Federal electoral district of Canada
This article is about the federal electoral district. For the provincial electoral district, see Toronto Centre (provincial electoral district) .
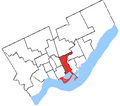
Toronto Centre electoral district Toronto Centre in relation to other Toronto ridings (2015 boundaries)
Legislature House of Commons MP Marci Ien Liberal District created 1933 First contested 1935 Last contested 2020 District webpage profile , map Population (2016 )[1] 103,805 Electors (2020)81,861 Area (km²)[1] 5.84 Pop. density (per km²) 17,774.8 Census division(s) Toronto Census subdivision(s) Toronto
Toronto Centre (French : Toronto-Centre electoral district in Toronto , Ontario , Canada, that has been represented in the House of Commons of Canada from 1872 to 1925, and since 1935, under the names Centre Toronto (1872–1903), Toronto Centre (1903–1925, and since 2004), Rosedale (1935–1997), and Toronto Centre—Rosedale (1997–2004).
Toronto Centre covers the heart of Downtown Toronto . The riding contains areas such as Regent Park (Canada's first social housing development), St. James Town (a largely immigrant area and the most densely populated neighbourhood in Canada), Cabbagetown , Church and Wellesley (a historic LGBTQ2 neighbourhood), Ryerson University , The Toronto Eaton Centre and part of the city's financial district (the east side of Bay Street ). At just under six square kilometres, it is the smallest riding in Canada by area.
History [ ] Centre Toronto riding was first created in 1872 from portions of West Toronto and East Toronto . In 1903, the name was changed to Toronto Centre. In 1924, the riding was broken into Toronto East Centre , Toronto West Centre and Toronto South .
A riding covering much the same area was created in 1933 named "Rosedale" after the wealthy neighbourhood of Rosedale . This riding was replaced with "Toronto Centre—Rosedale" in 1996, but the quickly growing population resulted in large areas being shaved off on all sides. In 2003, Toronto Centre—Rosedale was abolished, and a new riding somewhat to the east was created named "Toronto Centre".
Each of the four major national political parties (the Liberal Party, the Conservative Party, the Green Party, and the NDP), have active federal and provincial riding associations which act as the local party organizations in the riding. Since the early 1990s, however, most contests have been between the Liberals and NDP.
This riding lost territory to University—Rosedale and Spadina—Fort York , and gained a small fraction of territory from Trinity—Spadina during the 2012 electoral redistribution . This made Toronto Centre the smallest size riding in the country, beating Papineau in Montreal by 4 km2 .[2]
Historically, the riding was one of the few in central Toronto where the Progressive Conservatives usually did well. The PCs held the riding for 34 of the 58 years from 1935 to 1993. However, it has been in Liberal hands without interruption since 1993. The 2012 federal electoral redistribution shifted much of the wealthier northern part of the riding, which included Rosedale , to the new riding of University—Rosedale .[3]
The riding was represented by former interim Liberal leader Bob Rae after the federal by-elections of March 17, 2008. Rae resigned from Parliament on July 31, 2013.[4] [5] Chrystia Freeland picked up the riding in the subsequent by-election, and held it until the 2015 Canadian federal election , when she chose to run for re-election in the new riding of University—Rosedale .
From 2015 to 2020, the riding was represented by Bill Morneau .[6] [6] by-election on October 26, 2020, the riding has been represented by Marci Ien .[7]
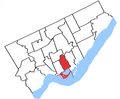
Former boundaries [ ] Demographics [ ] According to the Canada 2016 Census [8] Ethnic groups: 48.8% White, 11.8% South Asian, 11.1% Chinese, 9.1% Black, 5.0% Filipino, 2.5% Latin American, 1.8% Arab, 1.8% Korean, 1.6% Southeast Asian, 1.5% West Asian, 1.5% IndigenousLanguages: 58.4% English, 4.9% Mandarin, 3.4% French, 2.9% Cantonese, 2.7% Tagalog, 2.6% Spanish, 1.9% Bengali, 1.6% Arabic, 1.6% Tamil, 1.5% Korean, 1.4% Russian, 1.3% PersianReligions (2011): 45.0% Christian (23.5% Catholic, 4.2% Anglican, 2.5% Christian Orthodox, 2.4% United Church, 1.2% Presbyterian, 1.1% Baptist, 9.3% Other), 9.0% Muslim, 4.9% Hindu, 2.7% Buddhist, 1.8% Jewish, 35.0% None.[9] Median income: $30,987 (2015) Average income: $49,909 (2015)
Members of Parliament [ ] These ridings have elected the following Members of Parliament :
Parliament
Years
Member
Party
Centre TorontoRiding created from West Toronto and East Toronto
2nd
1872–1874 Robert Wilkes Liberal 3rd
1874–1875
1875–1878 John Macdonald Independent Liberal
4th
1878–1882 Robert Hay Liberal 5th
1882–1887 6th
1887–1891 George Ralph Richardson Cockburn Conservative 7th
1891–1896 8th
1896–1897 William Lount Liberal
1897–1900 George Hope Bertram
9th
1900–1904 William Rees Brock Conservative
Toronto Centre
10th
1904–1905 Edward Frederick Clarke Conservative
1905–1908 Edmund James Bristol
11th
1908–1911 12th
1911–1917 13th
1917–1921 Government (Unionist) 14th
1921–1925 Conservative
Riding dissolved into Toronto East Centre , Toronto West Centre and Toronto South
RosedaleRiding re-created from Toronto East Centre , Toronto West Centre and Toronto South
18th
1935–1940 Harry Gladstone Clarke Conservative 19th
1940–1945 Harry Jackman National Government 20th
1945–1949 Progressive Conservative 21st
1949–1953 Charles Henry Liberal 22nd
1953–1957 23rd
1957–1958 David James Walker Progressive Conservative 24th
1958–1962 25th
1962–1963 Donald Stovel Macdonald Liberal 26th
1963–1965 27th
1965–1968 28th
1968–1972 29th
1972–1974 30th
1974–1978
1978–1979 David Crombie Progressive Conservative
31st
1979–1980 32nd
1980–1984 33rd
1984–1988 34th
1988–1993 David MacDonald 35th
1993–1997 Bill Graham Liberal
Toronto Centre—Rosedale
36th
1997–2000 Bill Graham Liberal 37th
2000–2004
Toronto Centre
38th
2004–2006 Bill Graham Liberal 39th
2006–2007
2008–2008 Bob Rae
40th
2008–2011 41st
2011–2013
2013–2015 Chrystia Freeland
42nd
2015–2019 Bill Morneau 43rd
2019–2020
2020–present Marci Ien
Election results [ ] Toronto Centre, 2004–present [ ] Graph of election results in Toronto Centre (2003-, minor parties that never got 2% of the vote or didn't run consistently are omitted)
hide 2021 Canadian federal election
** Preliminary results — Not yet official **
Party
Candidate
Votes
%
Expenditures
Liberal Marci Ien 21,563
50.2
New Democratic Brian Chang
11,118
25.9
Conservative Ryan Lester
5,262
12.2
Green Annamie Paul 3,672
8.5
People's Syed Jeffrey
1,082
2.5
Communist Ivan Byard
176
0.4
Animal Protection Peter Stubbins
107
0.2
Total valid votes
Total rejected ballots
220 0.39 -0.10
Turnout
Eligible voters
80,007
Liberal hold
Swing
+8.2
Source: Elections Canada [10]
See also: 2020 Toronto Centre federal by-election
hide Bill Morneau
Party
Candidate
Votes
%
Liberal Marci Ien 10,581
42.0
-15.4
Green Annamie Paul 8,250
32.7
+25.6
New Democratic Brian Chang
4,280
17.0
-5.3
Conservative Benjamin Gauri Sharma
1,435
5.7
-6.4
People's Baljit Bawa
269
1.1
–
Libertarian Keith Komar
135
0.5
–
Independent Kevin Clarke 123
0.5
–
Free Party Canada
Dwayne Cappelletti
76
0.3
–
No affiliation
Above Znoneofthe
56
0.2
–
Total valid votes
25,205 100.0 –
Total rejected ballots
118 0.5 -0.2
Turnout
25,323 30.9 -35.2
Electors on lists
81,861
Liberal hold
Swing
-20.5
Elections Canada[11] [12]
hide 2019 Canadian federal election
Party
Candidate
Votes
%
Expenditures
Liberal Bill Morneau 31,271
57.37
−0.53
$95,538.84
New Democratic Brian Chang
12,142
22.27
−4.34
$58,656.81
Conservative Ryan Lester
6,613
12.13
−0.06
$39,309.94
Green Annamie Paul 3,852
7.07
+4.47
$34,903.20
Animal Protection Rob Lewin
182
0.33
–
$2,171.71
Rhinoceros Sean Carson
147
0.27
–
–
Independent Jason Tavares
126
0.23
–
–
Communist Bronwyn Cragg
125
0.23
−0.03
$626.58
Marxist–Leninist Philip Fernandez
54
0.10
−0.05
–
Total valid votes/Expense limit
54,512 99.30 – $107,308.65
Total rejected ballots
384 0.70 +0.18
Turnout
54,896 66.08 −3.27
Eligible voters
83,076
Liberal hold
Swing
+1.90
Source: Elections Canada [13] [14]
hide 2015 Canadian federal election
Party
Candidate
Votes
%
Expenditures
Liberal Bill Morneau 29,297
57.90
+18.48
$170,325.26
New Democratic Linda McQuaig 13,467
26.61
-9.58
$198,294.34
Conservative Julian Di Battista
6,167
12.19
-5.74
$22,625.73
Green Colin Biggin
1,315
2.60
-2.56
$3,964.97
Independent Jordan Stone
147
0.29
–
–
Communist Mariam Ahmad
133
0.26
–
–
Marxist–Leninist Philip Fernandez
76
0.15
–
–
Total valid votes/Expense limit
50,602 99.48 $203,952.21
Total rejected ballots
266 0.52 –
Turnout
50,868 69.35 –
Eligible voters
73,351
Source: Elections Canada [15] [16]
Liberal notional hold
Swing
+14.03
^ Change is from 2011 redistributed results.
hide November 25, 2013
Party
Candidate
Votes
%
Expenditures
Liberal Chrystia Freeland 17,194
49.38
+8.37
$ 97,609.64
New Democratic Linda McQuaig 12,640
36.30
+6.09
99,230.30
Conservative Geoff Pollock
3,004
8.63
−14.01
75,557.39
Green John Deverell
1,034
2.97
−2.05
21,521.10
Progressive Canadian Dorian Baxter 453
1.30
–
Libertarian Judi Falardeau
236
0.68
+0.18
–
Independent Kevin Clarke 84
0.24
560.00
Independent John "The Engineer" Turmel 56
0.16
–
Independent Leslie Bory
51
0.15
633.30
Online
Michael Nicula
43
0.12
200.00
Independent Bahman Yazdanfar
26
0.07
−0.12
1,134.60
Total valid votes/Expense limit
34,821 99.49 – $ 101,793.06
Total rejected ballots
177 0.51 +0.12
Turnout
34,998 37.72 −25.21
Eligible voters
92,780
Liberal hold
Swing
+1.14
By-election due to the resignation of Bob Rae .
2011 federal election redistributed results[17]
Party
Vote
%
Liberal 14,828
39.42
New Democratic 13,617
36.20
Conservative 6,746
17.93
Green 1,942
5.16
Others
487
1.29
hide 2011 Canadian federal election
Party
Candidate
Votes
%
Expenditures
Liberal Bob Rae 22,832
41.01
-12.51
$ 51,672.12
New Democratic Susan Wallace
16,818
30.21
+15.12
18,904.44
Conservative Kevin Moore
12,604
22.64
+4.32
63,141.66
Green Ellen Michelson
2,796
5.02
-6.83
44,006.84
Libertarian Judi Falardeau
277
0.50
–
Communist Cathy Holliday
159
0.29
-0.09
502.10
Independent Bahman Yazdanfar
108
0.19
653.91
Marxist–Leninist Philip Fernandez
76
0.14
-0.04
–
Total valid votes/Expense limit/Total expenditures
55,670 99.61 $ 92,663.68 $ 178,881.07
Total rejected ballots
220 0.39 -0.10
Turnout
55,890 62.93 +5.54
Eligible voters
88,810
Liberal hold
Swing
-13.82
2008 general election [ ] On September 21, 2008, Conservative candidate Chris Reid resigned because he said he couldn't commit to four years in government. However, blog entries were discovered that linked him to controversial musings on guns and the murder of Tim McLean aboard a Greyhound bus.[18] [19]
hide 2008 Canadian federal election
Party
Candidate
Votes
%
Expenditures
Liberal Bob Rae 27,462
53.53
-5.94
$ 48,353.21
Conservative David Gentili
9,402
18.33
+6.01
39,290.89
New Democratic El-Farouk Khaki 7,743
15.09
+1.21
21,305.27
Green Ellen Michelson
6,081
11.85
-1.56
23,041.16
Communist Johan Boyden
193
0.38
432.31
Animal Alliance Liz White 187
0.36
-0.15
685.91
Independent Gerald Derome
146
0.28
2,063.60
Marxist–Leninist Philip Fernandez
92
0.18
–
Total valid votes/Expense limit/Total Expenditures
51,306 99.50 $ 92,067.97 $ 135,172.35
Total rejected ballots
257 0.50 +0.10
Turnout
51,563 57.39 +29.52
Liberal hold
Swing
-5.97
2008 by-election [ ] Main article: 2008 Toronto Centre by-election
A by-election , held on March 17, 2008, to fill a vacancy created by the resignation of Bill Graham was won by Liberal Bob Rae , a former Ontario NDP Premier .
The nominated Conservative candidate in the by-election, Mark Warner , was dropped by the party's national council on October 31, 2007.[20] Don Meredith was nominated as the Conservative candidate in December 2007.[21]
Activist El-Farouk Khaki ran for the NDP and Chris Tindal was the Green Party of Canada candidate. Liz White was the Animal Alliance Environmental Voters Party of Canada candidate, and Doug Plumb represented the Canadian Action Party .
By-election on March 17, 2008
On Bill Graham 's resignation, July 2, 2007
Party
Candidate
Votes
%
±%
Liberal Bob Rae 14,187
59.47
+7.24
New Democratic El-Farouk Khaki 3,312
13.88
-9.86
Green Chris Tindal 3,199
13.41
+8.20
Conservative Donald Meredith 2,939
12.32
-5.89
Animal Alliance Liz White 123
0.52
+0.40
Canadian Action Doug Plumb
97
0.41
Total valid votes
23,857 99.60
Total rejected ballots
96 0.40
Turnout
23,953 27.86
Liberal hold
Swing
+8.5
hide 2006 Canadian federal election
Party
Candidate
Votes
%
Liberal Bill Graham 30,874
52.23
-4.30
New Democratic Michael Shapcott 14,036
23.74
-0.01
Conservative Lewis Reford
10,763
18.21
+3.42
Green Chris Tindal 3,080
5.21
+1.30
Communist Johan Boyden
120
0.2
-0.05
Independent Michel Prairie 101
0.2
Animal Alliance Liz White 72
0.12
Marxist–Leninist Philip Fernandez
66
0.11
-0.01
Total valid votes
59,112 100.00
Liberal hold
Swing
-2.1
hide 2004 Canadian federal election
Party
Candidate
Votes
%
Liberal Bill Graham 30,336
56.53
+1.26
New Democratic Michael Shapcott 12,747
23.75
+12.39
Conservative Megan Harris
7,936
14.79
−13.00
Green Gabriel Draven
2,097
3.91
Marijuana Jay Wagner
313
0.58
−0.94
Communist Dan Goldstick 106
0.20
−0.05
Marxist–Leninist Philip Fernandez
65
0.12
−0.12
Canadian Action Kevin Peck
63
0.12
−2.97
Total valid votes
53,663 100.00
Conservative vote is compared to the total of the Canadian Alliance vote and Progressive Conservative vote in 2000 election.
Toronto Centre—Rosedale, 1996–2003 [ ] Graph of general election results in Toronto Centre—Rosedale (1996-2003, minor parties that never got 2% of the vote or didn't run consistently are omitted)
hide 2000 Canadian federal election
Party
Candidate
Votes
%
Liberal Bill Graham 26,264
55.27
+6.08
Progressive Conservative Randall Pearce
8,150
17.15
-2.13
New Democratic David Berlin 5,398
11.36
-9.22
Alliance Richard Walker
5,057
10.64
+2.83
Canadian Action Paul Hellyer 1,466
3.09
+2.44
Marijuana Neev Tapiero
722
1.52
Natural Law David Gordon
224
0.47
-0.11
Communist Dan Goldstick 121
0.25
Marxist–Leninist Philip Fernandez
116
0.24
-0.11
Total valid votes
47,518 100.00
Note: Canadian Alliance vote is compared to the Reform vote in 1997 election.
hide 1997 Canadian federal election
Party
Candidate
Votes
%
Liberal Bill Graham 22,945
49.19
-0.80
New Democratic David MacDonald 9,597
20.58
+9.80
Progressive Conservative Stephen Probyn
8,993
19.28
-1.96
Reform John Stewart
3,646
7.82
-4.65
Green Jim Harris 577
1.24
+0.30
Canadian Action Anthony Robert Pedrette
303
0.65
Natural Law Ron Parker
270
0.58
-1.01
Marxist–Leninist Steve Rutchinski
166
0.36
+0.25
Independent Ted W. Culp
145
0.31
Total valid votes
46,642 100.00
Rosedale, 1933–1996 [ ] Graph of general election results in Rosedale (1933-1996, minor parties that never got 2% of the vote or didn't run consistently are omitted)
hide 1993 Canadian federal election
Party
Candidate
Votes
%
Liberal Bill Graham 25,726
50.00
+8.78
Progressive Conservative David MacDonald 10,930
21.24
-20.12
Reform Daniel Jovkovic
6,413
12.46
New Democratic Jack Layton 5,547
10.78
-4.28
National Martin Lanigan
1,091
2.12
Natural Law Doug Henning 817
1.59
Green Leslie Hunter
483
0.94
+0.22
Independent Linda Dale Gibbons
350
0.68
Marxist–Leninist Steve Rutchinski
57
0.11
Abolitionist Yann Patrice D'Audibert Garcien
40
0.08
Total valid votes
51,454 100.00
hide 1988 Canadian federal election
Party
Candidate
Votes
%
Progressive Conservative David MacDonald 22,704
41.36
-11.44
Liberal Bill Graham 22,624
41.21
+15.08
New Democratic Doug Wilson 8,266
15.06
-2.77
Libertarian Chris Blatchly
411
0.75
+0.09
Green Frank de Jong 397
0.72
-1.15
Rhinoceros Liane McLarty
265
0.48
Independent Mike Constable
102
0.19
Independent Harry Margel
91
0.17
Commonwealth of Canada Paul Therrien
33
0.06
-0.27
Total valid votes
54,893 100.00
hide 1984 Canadian federal election
Party
Candidate
Votes
%
Progressive Conservative David Crombie 23,211
52.80
+8.84
Liberal Bill Graham 11,488
26.13
-12.95
New Democratic Dell Wolfson
7,836
17.82
+2.97
Green Shirley Ruth Farlinger
821
1.87
Libertarian Clarke Slemon
291
0.66
+0.30
Communist Sylvie Baillargeon
172
0.39
+0.17
Commonwealth of Canada David Dube
144
0.33
Total valid votes
43,963 100.00
hide 1980 Canadian federal election
Party
Candidate
Votes
%
Progressive Conservative David Crombie 16,862
43.96
-3.30
Liberal Anne Cools 14,993
39.08
+6.07
New Democratic Jim Hockley
5,698
14.85
-2.69
Rhinoceros Geoff Yates
319
0.83
Libertarian Harry J. Nelson
140
0.36
-0.42
Independent Frank Sommers
125
0.33
Independent Ann Ladas
104
0.27
-0.18
Communist Dan Goldstick 85
0.22
+0.02
Marxist–Leninist Alan Miller
34
0.09
+0.01
Total valid votes
38,360 100.00
hide 1979 Canadian federal election
Party
Candidate
Votes
%
Progressive Conservative David Crombie 18,594
47.26
-10.69
Liberal Anne Cools 12,987
33.01
+1.72
New Democratic Ron B. Thomson
6,902
17.54
+8.24
Libertarian Alex W. Eaglesham 305
0.78
Independent Hans Blumenfeld
196
0.50
Independent Ann Ladas
176
0.45
Communist Dan Goldstick 80
0.20
-0.17
Independent Joanne Pritchard
49
0.12
Marxist–Leninist Alan Miller
32
0.08
Independent Sean Howes
27
0.07
–
Total valid votes
39,348 100.00
By-election on October 16, 1978
Party
Candidate
Votes
%
±%
Progressive Conservative David Crombie 18,732
57.95
+17.68
Liberal John Robert Evans 10,114
31.29
-17.84
New Democratic Ron B. Thomson
3,008
9.31
-0.06
Independent Donald M. Campbell
196
0.61
Independent Linda Cain
155
0.48
Communist Dan Goldstick 120
0.37
-0.02
Total valid votes
32,325 100.00
hide 1974 Canadian federal election
Party
Candidate
Votes
%
Liberal Donald Stovel Macdonald 17,227
49.13
+5.11
Progressive Conservative Hal Jackman 14,119
40.27
-0.42
New Democratic Maurice Desjardins
3,285
9.37
-3.22
Independent Marshall Bruce Evoy
220
0.63
Communist Dan Goldstick 136
0.39
Marxist–Leninist Vern Harper
75
0.21
Total valid votes
35,062 100.00
hide 1972 Canadian federal election
Party
Candidate
Votes
%
Liberal Donald Stovel Macdonald 16,073
44.02
-13.40
Progressive Conservative Warren Beamish
14,856
40.69
+11.44
New Democratic Ron Sabourin
4,598
12.59
+0.26
Independent Aline Gregory
892
2.44
Independent David Starbuck
95
0.26
Total valid votes
36,514 100.00
hide 1968 Canadian federal election
Party
Candidate
Votes
%
Liberal Donald Stovel Macdonald 19,011
57.42
+12.58
Progressive Conservative Bob Bradley
9,683
29.25
-5.16
New Democratic John Chamard
4,083
12.33
-8.41
Communist F. Nelson Clarke
183
0.55
Independent Fred Reiner ()
148
0.45
Total valid votes
33,108 100.00
1933–1965 [ ]
hide 1965 Canadian federal election
Party
Candidate
Votes
%
Liberal Donald Stovel Macdonald 9,757
44.84
-10.03
Progressive Conservative Hal Jackman 7,487
34.41
+5.38
New Democratic Harding E. Bishop
4,514
20.75
+5.67
Total valid votes
21,758 100.00
hide 1963 Canadian federal election
Party
Candidate
Votes
%
Liberal Donald Stovel Macdonald 12,860
54.87
+12.06
Progressive Conservative Hal Jackman 6,803
29.03
-11.28
New Democratic Harding E. Bishop
3,534
15.08
-0.79
Social Credit George Leslie
240
1.02
+0.01
Total valid votes
23,437 100.00
hide 1962 Canadian federal election
Party
Candidate
Votes
%
Liberal Donald Stovel Macdonald 10,191
42.81
+16.54
Progressive Conservative David J. Walker 9,597
40.31
-22.89
New Democratic Desmond Sparham
3,778
15.87
+5.34
Social Credit John David Brunne
240
1.01
Total valid votes
23,806 100.00
Note: NDP vote is compared to CCF vote in 1958 election.
hide 1958 Canadian federal election
Party
Candidate
Votes
%
Progressive Conservative David J. Walker 15,429
63.21
+8.93
Liberal Tom O'Neill
6,412
26.27
-4.87
Co-operative Commonwealth Tom McAulay
2,570
10.53
-2.75
Total valid votes
24,411 100.00
hide 1957 Canadian federal election
Party
Candidate
Votes
%
Progressive Conservative David J. Walker 12,415
54.28
+14.57
Liberal Charles Henry 7,122
31.14
-10.06
Co-operative Commonwealth Tom McAulay
3,038
13.28
-4.36
Social Credit Harvey Jamieson
299
1.31
Total valid votes
22,874 100.00
hide 1953 Canadian federal election
Party
Candidate
Votes
%
Liberal Charles Henry 8,702
41.20
+1.35
Progressive Conservative David J. Walker 8,386
39.70
+2.23
Co-operative Commonwealth Dudley Bristow
3,727
17.64
-5.04
Labor–Progressive Janet M. Clark
308
1.46
Total valid votes
21,123 100.00
hide 1949 Canadian federal election
Party
Candidate
Votes
%
Liberal Charles Henry 10,835
39.84
+10.85
Progressive Conservative Harry Jackman 10,189
37.47
-11.37
Co-operative Commonwealth Dudley Bristow
6,170
22.69
+4.69
Total valid votes
27,194 100.00
Note: Progressive Conservative vote is compared to "National Government" vote in 1945 election.
hide 1945 Canadian federal election
Party
Candidate
Votes
%
Progressive Conservative Harry Jackman 11,784
48.84
+3.38
Liberal William Kearns
6,997
29.00
-20.80
Co-operative Commonwealth David Cass-Beggs
4,342
17.99
+13.25
Labor–Progressive John Weir
1,006
4.17
Total valid votes
24,129 100.00
Note: Progressive Conservative vote is compared to "National Government" vote in 1940 election.
hide 1940 Canadian federal election
Party
Candidate
Votes
%
National Government Harry Jackman 12,519
52.36
+12.1
Liberal J. Louis Shannon 10,399
43.49
+8.25
Co-operative Commonwealth Norah Dymond
991
4.14
-5.52
Total valid votes
23,909 100.00
Note: "National Government" vote is compared to Conservative vote in 1935 election.
hide 1935 Canadian federal election
Party
Candidate
Votes
%
Conservative Harry Clarke 9,491
40.26
-13.62
Liberal George Alexander Urquhart
8,306
35.24
-10.88
Co-operative Commonwealth William Dennison 2,765
11.73
Reconstruction Bert Watts
2,277
9.66
Communist Samuel Scarlett
733
3.11
Total valid votes
23,572 100.00
Toronto Centre, 1903–1924 [ ] Graph of general election results in Toronto Centre (1904-1925, minor parties that never got 2% of the vote or didn't run consistently are omitted)
hide 1921 Canadian federal election
Party
Candidate
Votes
%
Conservative Edmund Bristol 5,985
53.88
-20.57
Liberal Norman McEachren
5,123
46.12
+21.91
Total valid votes
11,108 100.00
Note: Conservative vote is compared to Unionist vote in 1917 election.
hide 1917 Canadian federal election
Party
Candidate
Votes
%
Government (Unionist) Edmund Bristol 12,051
74.45
+11.19
Opposition (Laurier Liberals) Charles MacGuire
3,918
24.21
-12.53
Unknown
Archie Dramin
217
1.34
Total valid votes
16,186 100.00
Note: Unionist vote is compared to Liberal-Conservative vote in 1911 election.
hide 1908 Canadian federal election
Party
Candidate
Votes
%
Conservative Edmund Bristol 3,482
51.38
-0.96
Liberal T.C. Robinette
3,295
48.62
0.96
Total valid votes
6,777 100.00
Note: vote compared to 1904 election.
By-election on April 11, 1905
Party
Candidate
Votes
Conservative Edmund Bristol acc.
Centre Toronto, 1872–1903 [ ] Graph of general election results in Centre Toronto (1872-1900, minor parties that never got 2% of the vote or didn't run consistently are omitted)
hide 1900 Canadian federal election
Party
Candidate
Votes
%
Conservative William Rees Brock 2,625
50.34
+3.33
Liberal John Flett
2,411
46.23
-6.76
Labour Henry Hargrave
179
3.43
Total valid votes
5,215 100.00
By-election on September 30, 1897
Party
Candidate
Votes
%
±%
Liberal G.H. Bertram 2,212
52.99
+0.36
Conservative O.A. Howland
1,962
47.01
-0.36
Total valid votes
4,174 100.00
hide 1887 Canadian federal election
Party
Candidate
Votes
%
Conservative George Cockburn 2,282
55.52
Liberal John Harvie
1,828
44.48
-8.78
Total valid votes
4,110 100.00
hide 1882 Canadian federal election
Party
Candidate
Votes
%
Liberal Robert Hay 1,620
53.25
-5.58
Unknown
J.D. Edgar
1,422
46.75
Total valid votes
3,042 100.00
Note: vote compared to 1874 election.
By-election on December 4, 1875
Party
Candidate
Votes
Liberal John MacDonald acc.
hide 1872 Canadian federal election
Party
Candidate
Votes
%
Liberal Robert Wilkes 1,509
55.95
Unknown
Mr. Shanly
1,188
44.05
Total valid votes
2,697 100.00
See also [ ] References [ ]
^ Jump up to: a b Statistics Canada : 2017^ "Population and Dwelling Count Highlight Tables, 2016 Census" . 8 February 2017.^ "Toronto Centre boundaries description, 2013 Representation Order" . Elections Canada . Retrieved 13 August 2014 .^ Wingrove, Josh (11 July 2013). "Bob Rae sets departure date as First Nations work picks up" . The Globe and Mail . Retrieved 11 July 2013 . ^ "Bob Rae quits as MP in 'very emotional' decision" . CBC. 19 June 2013. Retrieved 11 July 2013 .^ Jump up to: a b MacLeod, Meredith (2020-08-17). "Finance Minister Bill Morneau resigning" . CTV News. ^ "Federal Liberals hold onto Toronto Centre, York Centre in byelections | CBC News" . CBC . Retrieved 2020-10-27 .^ https://www12.statcan.gc.ca/census-recensement/2016/dp-pd/prof/details/page.cfm?Lang=E&Geo1=FED&Code1=35108&Geo2=PR&Code2=35&SearchText=Toronto%20Centre&SearchType=Begins&SearchPR=01&B1=All&TABID=1&type=0 [bare URL ^ https://www12.statcan.gc.ca/nhs-enm/2011/dp-pd/prof/details/page.cfm?Lang=E&Geo1=FED2013&Code1=35108&Data=Count&SearchText=Toronto%20Centre&SearchType=Begins&SearchPR=01&A1=All&B1=All&Custom=&TABID=1 [bare URL ^ "Election night results" . Elections Canada . Retrieved 21 September 2021 .^ "Toronto Centre: October 26, 2020, by-elections — Poll-by-poll results" . Elections Canada. Retrieved September 16, 2021 .^ "October 26, 2020, By-elections: Official Voting Results" . Elections Canada. Retrieved September 16, 2021 .^ "List of confirmed candidates" . Elections Canada . Retrieved 4 October 2019 .^ "forty-third general election 2019 — Poll-by-poll results" . Elections Canada . Retrieved 20 August 2020 .^ Elections Canada – Confirmed candidates for Toronto Centre, 30 September 2015 ^ – forty-second general election 2015 — Poll-by-poll results ^ Pundits' Guide to Canadian Elections ^ [1] , ctv news , September 21, 2008^ [2] ,CBC News Online , September 21, 2008^ Tory candidates forced to withdraw , Unnati Gandhi, Globe and Mail , November 1, 2007^ Canadian Press Archived December 25, 2007, at the Wayback Machine
External links [ ] Riding history from the Library of Parliament :
show Federal ridings in Central Toronto
Liberal
show Federal ridings in Ontario
Central Eastern S Durham
City of Toronto Suburbs & Downtown )
Cities of Brampton &
Brampton
Brampton Centre Brampton East Brampton North Brampton South Brampton West Mississauga
Southern
Southwestern Halton City of Hamilton Niagara
Niagara Centre Niagara Falls Niagara West St. Catharines
Midwestern Northern Southwestern Ottawa See also : Provincial ridings in Ontario
show Historical federal ridings in Ontario
Until 2015 Until 2006 Until 2004 Until 2000 Until 1997 Until 1993 Until 1988 Until 1984 Until 1979 Until 1974 Until 1972 Until 1968 Until 1953 Until 1949 Until 1935 Until 1925 Until 1917 Until 1904 Until 1896 Until 1882
Coordinates : 43°39′40″N 79°22′08″W / 43.661°N 79.369°W / 43.661; -79.369