Variable renewable energy

Variable renewable energy (VRE) or intermittent renewable energy sources (IRES) are renewable energy sources that are not dispatchable due to their fluctuating nature, such as wind power and solar power, as opposed to controllable renewable energy sources, such as dammed hydroelectricity or biomass, or relatively constant sources, such as geothermal power.
The use of small amounts of intermittent power has little effect on grid operations. Using larger amounts of intermittent power may require upgrades or even a redesign of the grid infrastructure.[2][3] Options to absorb large shares of variable energy into the grid include using storage, improved interconnection between different variable sources to smooth out supply, using dispatchable energy sources as hydroelectric and having overcapacity, so that sufficient energy is produced even when weather is less favourable.
Background and terminology[]
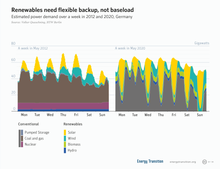
The penetration of intermittent renewables in most power grids is low: global electricity generation in 2020 was 7% wind and 3% solar.[4] European countries tend to have a much higher share of VRE in their generation mix, with Germany over 40% and the UK over 30%.[4] Characteristics of variable renewables include their unpredictability, variability, small size, their low running costs and the fact they are constrained to a certain location. These provide a challenge to grid operators, who must make sure supply and demand are matched. Solutions include energy storage, demand response, availability of overcapacity and sector coupling.[5] Smaller grids may be less tolerant to high levels of penetration.[2][6]
Matching power demand to supply is not a problem specific to intermittent power sources. Existing power grids already contain elements of uncertainty including sudden and large changes in demand and unforeseen power plant failures. Though power grids are already designed to have some capacity in excess of projected peak demand to deal with these problems, significant upgrades may be required to accommodate large amounts of intermittent power.[7]
Several key terms are useful for understanding the issue of intermittent power sources. These terms are not standardized, and variations may be used. Most of these terms also apply to traditional power plants.
- Intermittency or variability is the extent to which a power source fluctuates. This has two aspects: a predictable variability (such as the day-night cycle) and an unpredictable part (imperfect local weather forecasting).[8] The term intermittent can be used to refer to the unpredictable part, with variable then referring to the predictable part.[9]
- Dispatchability is the ability of a given power source to increase and decrease output quickly on demand. The concept is distinct from intermittency; dispatchability is one of several ways system operators match supply (generator's output) to system demand (technical loads).[10]
- Penetration in this context is generally used to refer to the amount of energy generated as a percentage of annual consumption.[11]
- Nominal power or nameplate capacity refers to the maximum output of a generating plant in normal operating conditions. This is the most common number used and typically expressed in Watt (including multiples like kW, MW, GW).
- Capacity factor, average capacity factor, or load factor is the average expected output of a generator, usually over an annual period. Expressed as a percentage of the nameplate capacity or in decimal form (e.g. 30% or 0.30).
- Firm capacity or firm power is "guaranteed by the supplier to be available at all times during a period covered by a commitment".[12]
- Capacity credit: generally the amount of output from a power source that may be statistically relied upon, practically the minimum power within a longer period, usually expressed as a percentage of the nominal power.[13] If the power source is far from the consumer, for example some wind power in China, the reliability of transmission also needs to be accounted for.[14]
- Foreseeability or predictability is how accurately the operator can anticipate the generation:[15] for example tidal power varies with the tides but is completely foreseeable because the orbit of the moon can be predicted exactly, and improved weather forecasts can make wind power more predictable.[16]
Sources[]
Conventional hydroelectricity, biomass and geothermal are completely dispatchable as each has a store of potential energy; wind and solar without storage can be decreased, but not dispatched, other than when nature provides. Between wind and solar, solar has a more variable daily cycle than wind, but is more predictable in daylight hours than wind. Like solar, tidal energy varies between on and off cycles through each day, unlike solar there is no intermittency, tides are available every day without fail. Biofuel and biomass involve multiple steps in the production of energy – growing plants, harvesting, processing, transportation, storage and burning to create heat for electricity, transportation or space heating. In the combined power plant used by the University of Kassel to simulate using 100% renewable energy, wind farms and solar farms were supplemented as needed by hydrostorage and biomass to follow the electricity demand.[17]
Wind power[]

Wind power forecasting is the least accurate of all of the variable renewable energy sources.[citation needed] Grid operators use day ahead forecasting to determine which of the available power sources to use the next day, and weather forecasting is used to predict the likely wind power and solar power output available. Although wind power forecasts have been used operationally for decades, as of 2019 the IEA is organizing international collaboration to further improve their accuracy.[18]


Wind-generated power is a variable resource, and the amount of electricity produced at any given point in time by a given plant will depend on wind speeds, air density, and turbine characteristics (among other factors). If wind speed is too low then the wind turbines will not be able to make electricity, and if it is too high the turbines will have to be shut down to avoid damage. While the output from a single turbine can vary greatly and rapidly as local wind speeds vary, as more turbines are connected over larger and larger areas the average power output becomes less variable.[7]
- Intermittence: Regions smaller than synoptic scale (less than about 1000 km long, the size of an average country) have mostly the same weather and thus around the same wind power, unless local conditions favor special winds. Some studies show that wind farms spread over a geographically diverse area will as a whole rarely stop producing power altogether.[19][20] However this is rarely the case for smaller areas with uniform geography such as Ireland,[21][22][23] Scotland[24] and Denmark which have several days per year with little wind power.[25]
- Capacity factor: Wind power typically has an annual capacity factor of 25–50%, with offshore wind outperforming onshore wind.[26]
- Dispatchability: Because wind power is not by itself dispatchable wind farms are sometimes built with storage.[27][28]
- Capacity credit: At low levels of penetration, the capacity credit of wind is about the same as the capacity factor. As the concentration of wind power on the grid rises, the capacity credit percentage drops.[29][30]
- Variability: Site dependent.[31] Sea breezes are much more constant than land breezes.[7] Seasonal variability may reduce output by 50%.[32]
- Reliability: A wind farm has high technical reliability when the wind blows. That is, the output at any given time will only vary gradually due to falling wind speeds or storms (the latter necessitating shut downs). A typical wind farm is unlikely to have to shut down in less than half an hour at the extreme, whereas an equivalent-sized power station can fail totally instantaneously and without warning. The total shutdown of wind turbines is predictable via weather forecasting. The average availability of a wind turbine is 98%, and when a turbine fails or is shut down for maintenance it only affects a small percentage of the output of a large wind farm.[33]
- Predictability: Although wind is variable, it is also predictable in the short term. There is an 80% chance that wind output will change less than 10% in an hour and a 40% chance that it will change 10% or more in 5 hours. Predictability increases as weather forecasts become better.[34] Denmark exports surplus wind power and imports during shortfalls to and from the EU grid, particularly Norwegian hydro, to balance supply with demand.[35]
Because wind power is generated by large numbers of small generators, individual failures do not have large impacts on power grids. This feature of wind has been referred to as resiliency.[36]
During the 2006 California heat wave output from wind power in California significantly decreased to an average of 4% of capacity for seven days.[37] A similar result was seen during the 2003 European heat wave, when the output of wind power in France, Germany, and Spain fell below 10% during peak demand times.[38]
According to an article in EnergyPulse, "the development and expansion of well-functioning day-ahead and real time markets will provide an effective means of dealing with the variability of wind generation."[39]
In Ontario, Canada, the Independent Electricity System Operator has been experimenting with dispatchable wind power to meet peak demands. In this case a number of wind generators are deliberately not connected to the grid, but are turning and ready to generate, and when the need for more power arises, they are connected to the grid. IESO is trying this as wind generators respond to sudden power demands much faster than gas-powered generators or hydroelectricity generators. [40]
Solar power[]

Solar power is more predictable than wind power and less variable – while there is never any solar power available during the night, and there is a reduction in winter, the only unknown factors in predicting solar output each day is cloud cover, frost and snow. Many days in a row in some locations are relatively cloud free, just as many days in a row in either the same or other locations are overcast – leading to relatively high predictability.[citation needed] Total world demand is roughly 12 TW, many times less than the amount that could be generated from potential wind and solar resources. From 40 to 85 TW could be provided from wind and about 580 TW from solar.[41]
Intermittency inherently affects solar energy, as the production of renewable electricity from solar sources depends on the amount of sunlight at a given place and time. Solar output varies throughout the day and through the seasons, and is affected by dust, fog, cloud cover, frost or snow. Many of the seasonal factors are fairly predictable, and some solar thermal systems make use of heat storage to produce grid power for a full day.[42]
- Variability: In the absence of an energy storage system, solar does not produce power at night, little in bad weather and varies between seasons. In many countries, solar produces most energy in seasons with low wind availability and visa versa.[43]
- Capacity factor Standard photovoltaic solar has an annual average capacity factor of 10-20%,[44] but panels that move and track the sun have a capacity factor up to 30%.[45] Thermal solar parabolic trough with storage 56%.[46] Thermal solar power tower with storage 73%.[46]
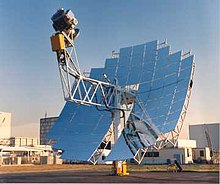
The impact of intermittency of solar-generated electricity will depend on the correlation of generation with demand. For example, solar thermal power plants such as Nevada Solar One are somewhat matched to summer peak loads in areas with significant cooling demands, such as the south-western United States. Thermal energy storage systems like the small Spanish Gemasolar Thermosolar Plant can improve the match between solar supply and local consumption. The improved capacity factor using thermal storage represents a decrease in maximum capacity, and extends the total time the system generates power.[47][48][49]
Run-of-the-river hydroelectricity[]
In many European counties and North America the environmental movement has eliminated the construction of dams with large reservoirs. Run of the river projects have continued to be built, such as the 695MW Keeyask Project in Canada which began construction in 2014.[50] The absence of a reservoir results in both seasonal and annual variations in electricity generated.
Tidal power[]

Tidal power is the most predictable of all the variable renewable energy sources. Twice a day the tides vary 100%, but they are never intermittent, on the contrary they are completely reliable. It is estimated that Britain could obtain 20% of energy from tidal power, only 20 sites in the world have yet been identified as possible tidal power stations.[51]
Wave power[]
Waves are primarily created by wind, so the power available from waves tends to follow that available from wind, but due to the mass of the water is less variable than wind power. Wind power is proportional to the cube of the wind speed, while wave power is proportional to the square of the wave height.[52][53][54]
Solutions for their integration[]
The use of intermittent sources relies on electric power grids that are carefully managed, for instance using highly dispatchable generation that is able to shut itself down whenever an intermittent source starts to generate power, and to successfully startup without warning when the intermittents stop generating.[55]
The displaced dispatchable generation could be coal, natural gas, biomass, nuclear, geothermal or storage hydro. Rather than starting and stopping nuclear or geothermal it is cheaper to use them as constant base load power. Any power generated in excess of demand can displace heating fuels, be converted to storage or sold to another grid. Biofuels and conventional hydro can be saved for later when intermittents are not generating power. Alternatives to burning coal and natural gas which produce fewer greenhouse gases may eventually make fossil fuels a stranded asset that is left in the ground. Highly integrated grids favor flexibility and performance over cost, resulting in more plants that operate for fewer hours and lower capacity factors.[56]
All sources of electrical power have some degree of variability, as do demand patterns which routinely drive large swings in the amount of electricity that suppliers feed into the grid. Wherever possible, grid operations procedures are designed to match supply with demand at high levels of reliability, and the tools to influence supply and demand are well-developed. The introduction of large amounts of highly variable power generation may require changes to existing procedures and additional investments.
The capacity of a reliable renewable power supply, can be fulfilled by the use of backup or extra infrastructure and technology, using mixed renewables to produce electricity above the intermittent average, which may be used to meet regular and unanticipated supply demands.[57] Additionally, the storage of energy to fill the shortfall intermittency or for emergencies can be part of a reliable power supply.
In practice, as the power output from wind varies, partially loaded conventional plants, which are already present to provide response and reserve, adjust their output to compensate. While low penetrations of intermittent power may use existing levels of response and spinning reserve, the larger overall variations at higher penetrations levels will require additional reserves or other means of compensation.
Operational reserve[]
All managed grids already have existing operational and "spinning" reserve to compensate for existing uncertainties in the power grid. The addition of intermittent resources such as wind does not require 100% "back-up" because operating reserves and balancing requirements are calculated on a system-wide basis, and not dedicated to a specific generating plant.
Some gas, or hydro power plants are partially loaded and then controlled to change as demand changes or to replace rapidly lost generation. The ability to change as demand changes is termed "response". The ability to quickly replace lost generation, typically within timescales of 30 seconds to 30 minutes, is termed "spinning reserve".
Generally thermal plants running as peaking plants will be less efficient than if they were running as base load. Hydroelectric facilities with storage capacity (such as the traditional dam configuration) may be operated as base load or peaking plants.
Grids can contract for grid battery plants, which provide immediately available power for an hour or so, which gives time for other generators to be started up in the event of a failure, and greatly reduces the amount of spinning reserve required.[58][59]
Demand response[]
Demand response is a change in consumption of energy to better align with supply. It can take the form of switching off loads, or absorb additional energy to correct supply/demand imbalances. Incentives have been widely created in the American, British and French systems for the use of these systems, such as favorable rates or capital cost assistance, encouraging consumers with large loads to take them offline whenever there is a shortage of capacity, or conversely to increase load when there is a surplus.
Certain types of load control allow the power company to turn loads off remotely if insufficient power is available. In France large users such as CERN cut power usage as required by the System Operator - EDF under the encouragement of the EJP tariff.[60][61]
Energy demand management refers to incentives to adjust use of electricity, such as higher rates during peak hours. Real-time variable electricity pricing can encourage users to adjust usage to take advantage of periods when power is cheaply available and avoid periods when it is more scarce and expensive.[62] Some loads such as desalination plants, Bitcoin miners, electric boilers and industrial refrigeration units, are able to store their output (water and heat). These "opportunistic loads" are able to take advantage of "burst electricity" when it is available.
Instantaneous demand reduction. Most large systems also have a category of loads which instantly disconnect when there is a generation shortage, under some mutually beneficial contract. This can give instant load reductions (or increases).
Storage[]

At times of low load where non-dispatchable output from wind and solar may be high, grid stability requires lowering the output of various dispatchable generating sources or even increasing controllable loads, possibly by using energy storage to time-shift output to times of higher demand. Such mechanisms can include:
Pumped storage hydropower is the most prevalent existing technology used, and can substantially improve the economics of wind power. The availability of hydropower sites suitable for storage will vary from grid to grid. Typical round trip efficiency is 80%.[7][66]
Traditional lithium-ion is the most common type used for grid-scale battery storage as of 2020.[67] Rechargeable flow batteries can serve as a large capacity, rapid-response storage medium.[10] Hydrogen can be created through electrolysis and stored for later use.[68]
Thermal energy storage stores heat. Stored heat can be used directly for heating needs or converted into electricity. In the context of a CHP plant a heat storage can serve as a functional electricity storage at comparably low costs. Ice storage air conditioning Ice can be stored inter seasonally and can be used as a source of air-conditioning during periods of high demand. Present systems only need to store ice for a few hours but are well developed.
Storage of electrical energy results in some lost energy because storage and retrieval are not perfectly efficient. Storage also requires capital investment and space for storage facilities.
Geographic diversity and complementing technologies[]

The variability of production from a single wind turbine can be high. Combining any additional number of turbines (for example, in a wind farm) results in lower statistical variation, as long as the correlation between the output of each turbine is imperfect, and the correlations are always imperfect due to the distance between each turbine. Similarly, geographically distant wind turbines or wind farms have lower correlations, reducing overall variability. Since wind power is dependent on weather systems, there is a limit to the benefit of this geographic diversity for any power system.[69]
Multiple wind farms spread over a wide geographic area and gridded together produce power more constantly and with less variability than smaller installations. Wind output can be predicted with some degree of confidence using weather forecasts, especially from large numbers of turbines/farms. The ability to predict wind output is expected to increase over time as data is collected, especially from newer facilities.[69]
Electricity produced from solar energy tends to counterbalance the fluctuating supplies generated from wind. Normally it is windiest at night and during cloudy or stormy weather, and there is more sunshine on clear days with less wind.[70] Besides, wind energy has often a peak in the winter season, whereas solar energy has a peak in the summer season; the combination of wind and solar reduces the need for dispatchable backup power.
- In some locations, electricity demand may have a high correlation with wind output,[citation needed]particularly in locations where cold temperatures drive electric consumption (as cold air is denser and carries more energy).
- The allowable penetration may be increased with further investment in standby generation. For instance some days could produce 80% intermittent wind and on the many windless days substitute 80% dispatchable power like natural gas, biomass and Hydro.
- Areas with existing high levels of hydroelectric generation may ramp up or down to incorporate substantial amounts of wind. Norway, Brazil, and Manitoba all have high levels of hydroelectric generation, Quebec produces over 90% of its electricity from hydropower, and Hydro-Québec is the largest hydropower producer in the world. The U.S. Pacific Northwest has been identified as another region where wind energy is complemented well by existing hydropower.[71] Storage capacity in hydropower facilities will be limited by size of reservoir, and environmental and other considerations.
Connecting grid internationally[]
It is often feasible to export energy to neighboring grids at times of surplus, and import energy when needed. This practice is common in Western Europe and North America. Integration with other grids can lower the effective concentration of variable power: for instance, Denmark's high penetration of VRE, in the context of the German/Dutch/Scandinavian grids with which it has interconnections, is considerably lower as a proportion of the total system. Peaking-plants or pumped-storage hydro-electricity that compensate for variability can be used across countries.
The capacity of power transmission infrastructure may have to be substantially upgraded to support export/import plans. Some energy is lost in transmission. The economic value of exporting variable power depends in part on the ability of the exporting grid to provide the importing grid with useful power at useful times for an attractive price.
Sector coupling[]
Demand and generation can be better matched when sectors such as mobility, heat and gas are coupled with the power system. The electric vehicle market is for instance expected to become the largest source of storage capacity. This may be a more expensive option appropriate for high penetration of variable renewables, compared to other sources of flexibility.[72] It International Energy Agency indicates sector coupling is needed to compensate for the mismatch between seasonal demand and supply.[73]
Electric vehicles can be charged during periods of low demand and high production, and in some places send power back from the vehicle-to-grid.[74][75]
Penetration[]
Penetration refers to the proportion of a primary energy (PE) source in an electric power system, expressed as a percentage.[11] There are several methods of calculation yielding different penetrations. The penetration can be calculated either as:[76]
- the nominal capacity (installed power) of a PE source divided by the peak load within an electric power system; or
- the nominal capacity (installed power) of a PE source divided by the total capacity of the electric power system; or
- the electrical energy generated by a PE source in a given period, divided by the demand of the electric power system in this period.
The level of penetration of intermittent variable sources is significant for the following reasons:
- Power grids with significant amounts of dispatchable pumped storage, hydropower with reservoir or pondage or other peaking power plants such as natural gas-fired power plants are capable of accommodating fluctuations from intermittent power more easily.[77]
- Relatively small electric power systems without strong interconnection (such as remote islands) may retain some existing diesel generators but consuming less fuel,[78] for flexibility[79] until cleaner energy sources or storage such as pumped hydro or batteries become cost-effective.[80]
In the early 2020s wind and solar produce 10% of the world's electricity,[81] but supply in the 20-50% penetration range has already been implemented in several systems,[82] with 65% advised for 2030 by the UK National Infrastructure Commission.[83]
There is no generally accepted maximum level of penetration, as each system's capacity to compensate for intermittency differs, and the systems themselves will change over time. Discussion of acceptable or unacceptable penetration figures should be treated and used with caution, as the relevance or significance will be highly dependent on local factors, grid structure and management, and existing generation capacity.
For most systems worldwide, existing penetration levels are significantly lower than practical or theoretical maximums.[76]
Maximum penetration limits[]
There is no generally accepted maximum penetration of wind energy that would be feasible in any given grid. Rather, economic efficiency and cost considerations are more likely to dominate as critical factors; technical solutions may allow higher penetration levels to be considered in future, particularly if cost considerations are secondary.
High penetration scenarios may be feasible in certain circumstances:
- Power generation for periods of little or no wind generation can be provided by retaining the existing power stations. The cost of using existing power stations for this purpose may be low since fuel costs dominate the operating costs. The actual cost of paying to keep a power station idle, but usable at short notice, may be estimated from published spark spreads and dark spreads. As existing traditional plant ages, the cost of replacing or refurbishing these facilities will become part of the cost of high-penetration wind if they are used only to provide operational reserve.
- Automatic load shedding of large industrial loads and its subsequent automatic reconnection is established technology and used in the UK and U.S., and known as Frequency Service contractors in the UK. Several GW are switched off and on each month in the UK in this way. Reserve Service contractors offer fast response gas turbines and even faster diesels in the UK, France and U.S. to control grid stability.
- In a close-to-100% wind scenario, surplus wind power can be allowed for by increasing the levels of the existing Reserve and Frequency Service schemes and by extending the scheme to domestic-sized loads. Energy can be stored by advancing deferrable domestic loads such as storage heaters, water heaters, fridge motors, electric cars, or even hydrogen production, and load can be shed by turning such equipment off.
- Alternatively or additionally, power can be exported to neighboring grids and re-imported later. HVDC cables are efficient with 3% loss per 1000 km and may be inexpensive in certain circumstances. Under such scenarios, the amount of transmission capacity required may be many times higher than currently available.
Economic impacts of variability[]
This section needs to be updated. The reason given is: no info on costs of seasonal variability e.g. of solar and seasonal demand variability. (September 2019) |
Estimates of the cost of wind energy may include estimates of the "external" costs of wind variability, or be limited to the cost of production. All electrical plant has costs that are separate from the cost of production, including, for example, the cost of any necessary transmission capacity or reserve capacity in case of loss of generating capacity. Many types of generation, particularly fossil fuel derived, will also have cost externalities such as pollution, greenhouse gas emission, and habitat destruction which are generally not directly accounted for. The magnitude of the economic impacts is debated and will vary by location, but is expected to rise with higher penetration levels. At low penetration levels, costs such as operating reserve and balancing costs are believed to be insignificant.
Intermittency may introduce additional costs that are distinct from or of a different magnitude than for traditional generation types. These may include:
- Transmission capacity: transmission capacity may be more expensive than for nuclear and coal generating capacity due to lower load factors. Transmission capacity will generally be sized to projected peak output, but average capacity for wind will be significantly lower, raising cost per unit of energy actually transmitted. However transmission costs are a low fraction of total energy costs.[84]
- Additional operating reserve: if additional wind does not correspond to demand patterns, additional operating reserve may be required compared to other generating types, however this does not result in higher capital costs for additional plants since this is merely existing plants running at low output - spinning reserve. Contrary to statements that all wind must be backed by an equal amount of "back-up capacity", intermittent generators contribute to base capacity "as long as there is some probability of output during peak periods". Back-up capacity is not attributed to individual generators, as back-up or operating reserve "only have meaning at the system level".[85]
- Balancing costs: to maintain grid stability, some additional costs may be incurred for balancing of load with demand. The ability of the grid to balance supply with demand will depend on the rate of change of the amount of energy produced (by wind, for example) and the ability of other sources to ramp production up or scale production down. Balancing costs have generally been found to be low.[citation needed]
- Storage, export and load management: at high penetrations solutions (described below) for dealing with high output of wind during periods of low demand may be required. These may require additional capital expenditures, or result in lower marginal income for wind producers.
Regulation and grid planning[]
Britain[]
The operator of the British electricity system has said that it will be capable of operating zero-carbon by 2025, whenever there is enough renewable generation, and may be carbon negative by 2033.[86] The company, National Grid Electricity System Operator, states that new products and services will help reduce the overall cost of operating the system.[87]
See also[]
- Energy security and renewable technology
- Ground source heat pump
- Cost of electricity by source
- Spark spread: calculating the cost of back up
- List of energy storage power plants
Further reading[]
- Sivaram, Varun (2018). Taming the Sun: Innovation to Harness Solar Energy and Power the Planet. Cambridge, MA: MIT Press. ISBN 978-0-262-03768-6.
References[]
- ^ Cartlidge, Edwin (2011-11-18). "Saving for a Rainy Day". Science. 334 (6058): 922–924. Bibcode:2011Sci...334..922C. doi:10.1126/science.334.6058.922. ISSN 0036-8075. PMID 22096185.
- ^ Jump up to: a b "All Island Grid Study" (PDF). Department of Communications, Energy and Natural Resources. January 2008. pp. 3–5, 15. Archived from the original (PDF) on 2009-03-18. Retrieved 2008-10-15.
- ^ "The Carbon Trust & DTI Renewables Network Impacts Study" (PDF). Carbon Trust and UK Department of Trade and Industry. January 2004 [commissioned June 2003]. Archived from the original (PDF) on 2010-09-19. Retrieved 2009-04-22.
- ^ Jump up to: a b "Nearly half of Germany's electricity has come from wind and solar this year". World Economic Forum. Retrieved 2021-02-10.
- ^ Sinsel, Simon R.; Riemke, Rhea L.; Hoffmann, Volker H. (2020-01-01). "Challenges and solution technologies for the integration of variable renewable energy sources—a review". Renewable Energy. 145: 2271–2285. doi:10.1016/j.renene.2019.06.147. hdl:20.500.11850/373407. ISSN 0960-1481.
- ^ Czisch, Gregor; Gregor Giebel. "Realisable Scenarios for a Future Electricity Supply based 100% on Renewable Energies" (PDF). Institute for Electrical Engineering – Efficient Energy Conversion University of Kassel, Germany and Risø National Laboratory, Technical University of Denmark. Archived from the original (PDF) on 2014-07-01. Retrieved 2008-10-15.
- ^ Jump up to: a b c d "Variability of Wind Power and other Renewables: Management Options and Strategies" (PDF). IEA. 2005. Retrieved 2008-10-15.
- ^ Widén, Joakim; Carpman, Nicole (1 April 2015). "Variability assessment and forecasting of renewables: A review for solar, wind, wave and tidal resources". Renewable and Sustainable Energy Reviews. 44: 356–375. doi:10.1016/j.rser.2014.12.019. ISSN 1364-0321.
- ^ Pommeret, Aude; Schubert, Katheline (2019). "Energy Transition with Variable and Intermittent Renewable Electricity Generation". CESifo Working Paper. 7442: 2. Cite journal requires
|journal=(help) - ^ Jump up to: a b Kuntz, Mark T.; Justin Dawe (2005). "renewable. rechargeable. remarkable". VRB Power Systems. Mechanical Engineering. Archived from the original on 2009-01-15. Retrieved 2008-10-20.
- ^ Jump up to: a b International Energy Agency Wind Task Force, "Design and Operation of Power Systems with Large Amounts of Wind Power" Archived 2007-10-25 at the Wayback Machine Oklahoma Conference Presentation, October 2006
- ^ "firm power". www.ecowho.com. Retrieved 2021-02-10.
- ^ Giebel, Gregor. "WIND POWER HAS A CAPACITY CREDIT" (PDF). Risø National Laboratory. Archived from the original (PDF) on 2009-03-18. Retrieved 2008-10-16.
- ^ "Available Capacity Credit of Large Wind Power Development in China - IEEE Smart Grid". smartgrid.ieee.org. Retrieved 2021-02-10.
- ^ "Defining and Quantifying Intermittency in the Power Sector". Energies.
- ^ "Volatile but predictable: Forecasting renewable power generation". Clean Energy Wire. 2016-08-15. Retrieved 2021-02-10.
- ^ "The Combined Power Plant: the first stage in providing 100% power from renewable energy". SolarServer. January 2008. Retrieved 10 October 2008.
- ^ "IEA wind task 36". iea wind forecasting. Retrieved 2019-07-25.
- ^ "The power of multiples: Connecting wind farms can make a more reliable and cheaper power source". 2007-11-21.
- ^ Archer, C. L.; Jacobson, M. Z. (2007). "Supplying Baseload Power and Reducing Transmission Requirements by Interconnecting Wind Farms" (PDF). Journal of Applied Meteorology and Climatology. 46 (11): 1701–1717. Bibcode:2007JApMC..46.1701A. CiteSeerX 10.1.1.475.4620. doi:10.1175/2007JAMC1538.1.
- ^ David JC MacKay. "Sustainable Energy - without the hot air. Fluctuations and storage".
- ^ Andrzej Strupczewski. "Czy w Polsce wiatr wystarczy zamiast elektrowni atomowych?" [Can the wind suffice instead of nuclear power in Poland?] (in Polish). atom.edu.pl. Archived from the original on 2011-09-04. Retrieved 2009-11-26.
- ^ Diesendorf, Mark (August 2007). "The Base-Load Fallacy" (PDF). Institute of Environmental Studies. www.energyscience.org.au. Archived from the original (PDF) on 2008-07-08. Retrieved 2008-10-18.
- ^ "Analysis of UK Wind Generation" 2011
- ^ Sharman, Hugh (May 2005). "Why wind power works for Denmark". Proceedings of the Institution of Civil Engineers - Civil Engineering. 158 (2): 66–72. doi:10.1680/cien.2005.158.2.66.
- ^ "Average annual capacity factors by technology, 2018 – Charts – Data & Statistics". IEA. Retrieved 2021-02-10.
- ^ "How Dispatchable Wind Is Becoming a Reality in the US". www.greentechmedia.com. Retrieved 2020-08-10.
- ^ "51MWh vanadium flow battery system ordered for wind farm in northern Japan". Energy Storage News. Retrieved 2020-08-10.
- ^ "Blowing Away the Myths" (PDF). The British Wind Energy Association. February 2005. Archived from the original (PDF) on 2007-07-10. Retrieved 2008-10-16.
- ^ Nedic, Dusko; Anser Shakoor; Goran Strbac; Mary Black; Jim Watson; Catherine Mitchell (July 2005). "Security assessment of future UK electricity scenarios" (PDF). Tyndall Centre for Climate Change Research. Archived from the original (PDF) on January 11, 2007. Retrieved 2008-10-20.
- ^ name="Junling">Junling Huang; Xi Lu; Michael B. McElroy (2014). "Meteorologically defined limits to reduction in the variability of outputs from a coupled wind farm system in the Central US" (PDF). Renewable Energy. 62: 331–340. doi:10.1016/j.renene.2013.07.022.
- ^ [1] Graham Sinden (1 December 2005). "Characteristics of the UK wind resource" pg4
- ^ Reliability of Wind Turbines[permanent dead link]
- ^ "Wind Systems Integration Basics". Archived from the original on 7 June 2012.
- ^ Modern Power Systems, Sept 25, 2009, Maj. Dang Trong
- ^ "renewable is doable A Smarter Energy Plan for Ontario (brochure version)" (PDF). PEMBINA Institute. August 2007. Retrieved 2008-10-17.
- ^ Dixon, David (September 2006). "Wind Generation's Performance during the July 2006 California Heat Storm". Energy Pulse. Archived from the original on 2007-02-28. Retrieved 2008-10-18.
- ^ (in French) Ministère de l'Écologie, du Développement et de l'Aménagement Durables. Notre système électrique à l'épreuve de la canicule.
Google translated version. - ^ Wind Integration: An Introduction to the State of the Art
- ^ "2016".
- ^ Jacobson, Mark Z.; Delucchi, M.A. (November 2009). "A Path to Sustainable Energy by 2030" (PDF). Scientific American. 301 (5): 58–65. Bibcode:2009SciAm.301e..58J. doi:10.1038/scientificamerican1109-58. PMID 19873905.
- ^ Gemasolar, energía non stop Archived 2013-02-06 at the Wayback Machine Spanish 26 October 2011
- ^ Jurasz, J.; Canales, F.A.; Kies, A.; Guezgouz, M.; Beluco, A. (2020-01-01). "A review on the complementarity of renewable energy sources: Concept, metrics, application and future research directions". Solar Energy. 195: 703–724. arXiv:1904.01667. Bibcode:2020SoEn..195..703J. doi:10.1016/j.solener.2019.11.087. ISSN 0038-092X.
- ^ "Average annual capacity factors by technology, 2018 – Charts – Data & Statistics". IEA. Retrieved 2021-02-10.
- ^ World Energy Perspective (PDF) (Report). World Energy Council. 2013. p. 21.
- ^ Jump up to: a b "Executive Summary: Assessment of Parabolic Trough and Power Tower Solar Technology Cost and Performance Forecasts" (PDF). National Renewable Energy Laboratory. October 2003. Retrieved 2016-11-07.
- ^ Spain Pioneers Grid-Connected Solar-Tower Thermal Power p. 3. Retrieved December 19, 2008.
- ^ Mills, David; Robert G. Morgan (July 2008). "A solar-powered economy: How solar thermal can replace coal, gas and oil". RenewableEnergyWorld.com. Retrieved 2008-10-17.
- ^ "Solar Air Cooling". Integration of Renewable energy on Farms. March 2008. Archived from the original on 2011-07-06. Retrieved 2008-10-17.
- ^ "Project Description – Keeyask Hydropower Limited Partnership". 10 February 2011.
- ^ Tidal power
- ^ Wind and Waves
- ^ "Comparing the Variability of Wind Speed and Wave Height Data" (PDF). Archived from the original (PDF) on 2012-06-17. Retrieved 2012-06-04.
- ^ "Savenkov, M 2009 'On the Truncated Weibull Distribution and its Usefulness in Evaluating the Theoretical Capacity Factor of Potential Wind (or Wave) Energy Sites', University Journal of Engineering and Technology, vol. 1, no. 1, pp. 21-25" (PDF). Archived from the original (PDF) on 2015-02-22. Retrieved 2014-11-30.
- ^ US Department of Energy: Maintaining Reliability in the Modern Power System, December 2016, p. 17
- ^ Michael G. Richard: Death by 'capacity factor': Is this how wind and solar ultimately win the game?, 2015-10-06
- ^ "Solar and Energy Storage: A Perfect Match - Energy Storage to the Test". RenewableEnergyWorld.com. Retrieved 2011-03-08.
- ^ "UK battery storage capacity could reach 70% growth in 2019 as business models evolve". Solar Power Portal.
- ^ "UK battery storage market reaches 1GW landmark as new applications continues to grow". Solar Power Portal.
- ^ http://www.claverton-energy.com/how-cern-is-encouraged-to-not-do-atom-or-quark-smashing-during-periods-of-high-demand-and-low-power-station-availablity-by-means-of-the-ejp-tarrif.html - Extract from CERN newsletter indication when to switch of loads
- ^ http://www.claverton-energy.com/download/42/ description of EJP tariff Archived December 8, 2008, at the Wayback Machine
- ^ "2005 Integrated Energy Policy Report". California Energy Commission. November 21, 2005. Retrieved 2006-04-21.
- ^ Wright, matthew; Hearps, Patrick; et al. Australian Sustainable Energy: Zero Carbon Australia Stationary Energy Plan, Energy Research Institute, University of Melbourne, October 2010, p. 33. Retrieved from BeyondZeroEmissions.org website.
- ^ Innovation in Concentrating Thermal Solar Power (CSP), RenewableEnergyFocus.com website.
- ^ Solana: 10 Facts You Didn't Know About the Concentrated Solar Power Plant Near Gila Bend
- ^ Benitez, Pablo C.; Lilianna E. Dragulescu; G. Cornelis Van Kooten (February 2006). "The Economics of Wind Power with Energy Storage". Resource Economics and Policy Analysis (REPA) Research Group. Department of Economics, University of Victoria. Retrieved 2008-10-20.
- ^ "Grid-Scale Battery Storage Frequently Asked Questions" (PDF).
- ^ "The global race to produce hydrogen offshore". BBC News. 2021-02-12. Retrieved 2021-02-12.
- ^ Jump up to: a b name="Junling">Junling Huang; Michael B. McElroy (2014). "Meteorologically defined limits to reduction in the variability of outputs from a coupled wind farm system in the Central US" (PDF). Renewable Energy. 62: 331–340. doi:10.1016/j.renene.2013.07.022.
- ^ Lovins, Amory; L. Hunter Lovins (November 1983). "The Fragility of Domestic Energy" (PDF). The Atlantic. Archived from the original (PDF) on June 25, 2008. Retrieved 2008-10-20.
- ^ https://www.washingtonpost.com/wp-dyn/content/article/2007/03/20/AR2007032001634.html "Air, Water Powerful Partners in Northwest", Washington Post, March 20, 2007
- ^ IRENA (2018). Power System Flexibility for the Energy Transition, Part 1: Overview for policy makers (PDF). Abu Dhabi: International Renewable Energy Agency. pp. 25, 42. ISBN 978-92-9260-089-1.
- ^ "System integration of renewables – Topics". IEA. Retrieved 2021-05-21.
- ^ "Is Vehicle-to-Grid Technology the Key to Accelerating the Clean Energy Revolution?". POWER Magazine. 2020-11-09. Retrieved 2021-02-12.
- ^ "UK city of Nottingham uses vehicle-to-grid (V2G) and IoT to optimise EV fleet charging". Traffic Technology Today. 2021-01-18. Retrieved 2021-02-12.
- ^ Jump up to: a b Gross, Robert; Heptonstall, Philip; Anderson, Dennis; Green, Tim; Leach, Matthew; Skea, Jim (March 2006). The Costs and Impacts of Intermittency (PDF). UK Energy Research Council. ISBN 978-1-903144-04-6. Archived from the original (PDF) on 2009-03-18. Retrieved 2010-07-22.
- ^ http://repa.econ.uvic.ca/publications/Working%20Paper%202006-02.pdf[permanent dead link]
- ^ Shumais, Mohamed; Mohamed, Ibrahim. "DIMENSIONS OF ENERGY INSECURITY ON SMALL ISLANDS: THE CASE OF THE MALDIVES" (PDF).
- ^ "Transforming small-island power systems". /publications/2019/Jan/Transforming-small-island-power-systems. Retrieved 2020-09-08.
- ^ "Shining a light on a smart island". MAN Energy Solutions. Retrieved 2020-09-08.
- ^ "Wind and solar produce record 10% of world's electricity, but faster change needed, scientists warn". www.independent.co.uk. 13 August 2020. Retrieved 2020-09-08.
- ^ "Will system integration of renewables be a major challenge by 2023? – Analysis". IEA. Retrieved 2020-09-08.
- ^ Ltd, Renews (2020-08-11). "Britain urged to hit 65% renewables by 2030". reNEWS - Renewable Energy News. Retrieved 2020-09-08.
- ^ http://www.claverton-energy.com/what-is-the-cost-per-kwh-of-bulk-transmission-national-grid-in-the-uk-note-this-excludes-distribution-costs.html Electric power transmission costs per kWh transmission / National Grid in the UK (note this excludes distribution costs)
- ^ http://www.ukerc.ac.uk/component/option,com_docman/task,doc_download/gid,550/ Archived 2007-07-06 at the Wayback Machine The Costs and Impacts of Intermittency, UK Energy Research Council, March 2006
- ^ Ambrose, Jillian (2020-07-27). "UK electricity grid's carbon emissions could turn negative by 2033, says National Grid". The Guardian. ISSN 0261-3077. Retrieved 2020-11-03.
- ^ "Zero carbon operation of Great Britain's electricity system by 2025 | National Grid ESO". www.nationalgrideso.com. Retrieved 2019-07-09.
External links[]
- Electric power distribution
- Energy storage
- Renewable energy