Greene County, Illinois
Greene County | |
|---|---|
U.S. county | |
 | |
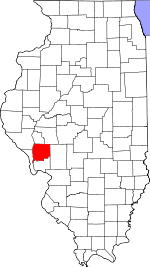 Location within the U.S. state of Illinois | |
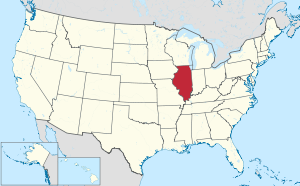 Illinois's location within the U.S. | |
| Coordinates: 39°21′N 90°23′W / 39.35°N 90.39°W | |
| Country | |
| State | |
| Founded | 1821 |
| Named for | Nathanael Greene |
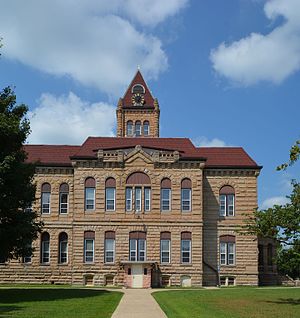
| Seat | Carrollton |
| Largest city | Carrollton |
| Area | |
| • Total | 546 sq mi (1,410 km2) |
| • Land | 543 sq mi (1,410 km2) |
| • Water | 3.3 sq mi (9 km2) 0.6% |
| Population (2010) | |
| • Total | 13,886 |
| • Estimate (2018) | 13,044 |
| • Density | 25/sq mi (9.8/km2) |
| Time zone | UTC−6 (Central) |
| • Summer (DST) | UTC−5 (CDT) |
| Congressional district | 13th |
| Website | https:// |

Greene County is a county located in the U.S. state of Illinois. According to the 2010 United States Census, it has a population of 13,886.[1] Its county seat is Carrollton.[2]
A notable archaeological area, the Koster Site, has produced evidence of more than 7,000 years of human habitation. Artifacts from the site are displayed at the Center for American Archeology in Kampsville, Illinois.
History[]
Greene County is named in honor of General Nathanael Greene, a hero of the American Revolutionary War.[3] In 1821, three years after Illinois became a state, Green County was established, being carved out of what was previously Madison county and St. Clair county before that. Over the course of the next 18 years four Greene county four more counties were formed out of what was once Greene Country. These include Scott, Morgan, Macoupin and Jersey counties. This left Greene county with approximately 546 square miles of land located in western-central Illinois near the Illinois River, which was an important resource that provided both a means for travel and to ship goods. Like much of southern Illinois the earliest settlers in the county came from the upland southern states such as North and South Carolina, Virginia, Kentucky, and Tennessee. By the time of the Civil War, 1860, the population of Greene County had grown to 16,093 and 10% of the adult population had been born in the northeast, 15% were foreign born, 25% were born in southern states, and almost 50% had been born in the Midwest. Of the population born in the Midwest many could still trace their roots to the upland south, with almost 80% of them having a parents born in a southern state.[4]
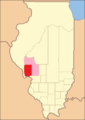
Greene County from its creation in 1821 to 1823, including unorganized territory temporarily attached to it.[5]

Greene County between 1823 and 1825

Greene between 1825 and 1829
Greene between 1829 and 1839

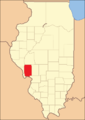
Greene in 1839 after the creation of Jersey County reduced Greene to its current size


Geography[]
According to the US Census Bureau, the county has a total area of 546 square miles (1,410 km2), of which 543 square miles (1,410 km2) is land and 3.3 square miles (8.5 km2) (0.6%) is water.[6]
Climate and weather[]
| Carrollton, Illinois | ||||||||||||||||||||||||||||||||||||||||||||||||||||||||||||
|---|---|---|---|---|---|---|---|---|---|---|---|---|---|---|---|---|---|---|---|---|---|---|---|---|---|---|---|---|---|---|---|---|---|---|---|---|---|---|---|---|---|---|---|---|---|---|---|---|---|---|---|---|---|---|---|---|---|---|---|---|
| Climate chart (explanation) | ||||||||||||||||||||||||||||||||||||||||||||||||||||||||||||
| ||||||||||||||||||||||||||||||||||||||||||||||||||||||||||||
| ||||||||||||||||||||||||||||||||||||||||||||||||||||||||||||
In recent years, average temperatures in the county seat of Carrollton have ranged from a low of 16 °F (−9 °C) in January to a high of 87 °F (31 °C) in July, although a record low of −26 °F (−32 °C) was recorded in January 1912 and a record high of 113 °F (45 °C) was recorded in July 1934. Average monthly precipitation ranged from 1.60 inches (41 mm) in January to 4.34 inches (110 mm) in May.[7]
Major highways[]
 U.S. Highway 67
 Illinois Route 100
 Illinois Route 108
 Illinois Route 267
Adjacent counties[]
- Scott County - north
- Morgan County - north
- Macoupin County - east
- Jersey County - south
- Calhoun County - southwest
- Pike County - northwest
National protected area[]
- Two Rivers National Wildlife Refuge (part: Apple Creek Division)
Demographics[]
| Historical population | |||
|---|---|---|---|
| Census | Pop. | %± | |
| 1830 | 7,674 | — | |
| 1840 | 11,951 | 55.7% | |
| 1850 | 12,429 | 4.0% | |
| 1860 | 16,093 | 29.5% | |
| 1870 | 20,277 | 26.0% | |
| 1880 | 23,010 | 13.5% | |
| 1890 | 23,791 | 3.4% | |
| 1900 | 23,402 | −1.6% | |
| 1910 | 22,363 | −4.4% | |
| 1920 | 22,883 | 2.3% | |
| 1930 | 20,417 | −10.8% | |
| 1940 | 20,292 | −0.6% | |
| 1950 | 18,852 | −7.1% | |
| 1960 | 17,460 | −7.4% | |
| 1970 | 17,014 | −2.6% | |
| 1980 | 16,661 | −2.1% | |
| 1990 | 15,317 | −8.1% | |
| 2000 | 14,761 | −3.6% | |
| 2010 | 13,886 | −5.9% | |
| 2018 (est.) | 13,044 | [8] | −6.1% |
| US Decennial Census[9] 1790-1960[10] 1900-1990[11] 1990-2000[12] 2010-2013[1] | |||

As of the 2010 United States Census, there were 13,886 people, 5,570 households, and 3,777 families living in the county.[13] The population density was 25.6 inhabitants per square mile (9.9/km2). There were 6,389 housing units at an average density of 11.8 per square mile (4.6/km2).[6] The racial makeup of the county was 97.9% white, 0.9% black or African American, 0.2% American Indian, 0.1% Asian, 0.3% from other races, and 0.7% from two or more races. Those of Hispanic or Latino origin made up 0.8% of the population.[13] In terms of ancestry, 30.7% were German, 14.7% were Irish, 13.3% were English, and 12.1% were American.[14]
Of the 5,570 households, 30.9% had children under the age of 18 living with them, 53.0% were married couples living together, 9.4% had a female householder with no husband present, 32.2% were non-families, and 27.8% of all households were made up of individuals. The average household size was 2.44 and the average family size was 2.95. The median age was 41.6 years.[13]
The median income for a household in the county was $41,450 and the median income for a family was $52,049. Males had a median income of $38,185 versus $27,231 for females. The per capita income for the county was $22,107. About 11.8% of families and 15.1% of the population were below the poverty line, including 22.1% of those under age 18 and 10.0% of those age 65 or over.[15]
Communities[]
Cities[]
Villages[]
Unincorporated communities[]
Townships[]
Politics[]
Greene County was reliably Democratic from the beginning through 1948; only one Republican Party nominee carried the county vote during that period. Since then it has usually voted for the Republican presidential nominee (14 of 18 elections).
As one of the most northerly “southern” counties in Illinois, Greene County was rock-ribbed Democratic for the seventy years after the Civil War, which it opposed as a “Yankee” war. Not until considerable anti-Catholic sentiment against Al Smith turned many voters to Herbert Hoover did the county support a Republican presidential nominee. However, with the coming of World War II, opposition to American involvement led to gains for Wendell Willkie and Thomas E. Dewey, although apart from the 1960 election – also influenced by Catholicism – Greene was a bellwether county throughout the period from 1928 to 2004.
In recent years, like most of rural downstate Illinois, opposition to the Democratic Party's liberal views on social issues, along with economic problems, has caused very rapid swings toward the Republican Party. Hillary Clinton’s 2016 tally of 21.68 percent of the county’s vote is 14.3 percent worse than any Democrat presidential candidate before 2012.[16]
Political culture[]
See also[]
References[]
- ^ Jump up to: a b "State & County QuickFacts". US Census Bureau. Archived from the original on June 6, 2011. Retrieved July 5, 2014.
- ^ "Find a County". National Association of Counties. Archived from the original on May 31, 2011. Retrieved June 7, 2011.
- ^ Gannett, Henry (1905). The Origin of Certain Place Names in the United States. Govt. Print. Off. p. 143.
- ^ Greene County, Illinois : history & families. Francis, Charles A., Greene County Historical Society (Ill.). Morley, Missouri. ISBN 978-1-942613-43-5. OCLC 987445234.CS1 maint: others (link)
- ^ White, Jesse. Origin and Evolution of Illinois Counties. State of Illinois, March 2010. [1]
- ^ Jump up to: a b "Population, Housing Units, Area, and Density: 2010 - County". US Census Bureau. Archived from the original on February 12, 2020. Retrieved July 11, 2015.
- ^ Jump up to: a b "Monthly Averages for Carrollton, Illinois". The Weather Channel. Retrieved January 27, 2011.
- ^ "Population and Housing Unit Estimates". Retrieved November 6, 2019.
- ^ "US Decennial Census". US Census Bureau. Retrieved July 5, 2014.
- ^ "Historical Census Browser". University of Virginia Library. Retrieved July 5, 2014.
- ^ "Population of Counties by Decennial Census: 1900 to 1990". US Census Bureau. Retrieved July 5, 2014.
- ^ "Census 2000 PHC-T-4. Ranking Tables for Counties: 1990 and 2000" (PDF). US Census Bureau. Retrieved July 5, 2014.
- ^ Jump up to: a b c "Profile of General Population and Housing Characteristics: 2010 Demographic Profile Data". US Census Bureau. Archived from the original on February 13, 2020. Retrieved July 11, 2015.
- ^ "Selected Social Characteristics in the United States – 2006-2010 American Community Survey 5-Year Estimates". US Census Bureau]]. Archived from the original on February 13, 2020. Retrieved July 11, 2015.
- ^ "Selected Economic Characteristics – 2006-2010 American Community Survey 5-Year Estimates". US Census Bureau. Archived from the original on February 13, 2020. Retrieved July 11, 2015.
- ^ "Vote Total Search Election Results". www.elections.il.gov. Retrieved November 17, 2020.
- ^ http://uselectionatlas.org/RESULTS
| show Places adjacent to Greene County, Illinois |
|---|
| show Municipalities and communities of Greene County, Illinois, United States |
|---|

| show Authority control |
|---|
- Illinois counties
- Greene County, Illinois
- 1821 establishments in Illinois
- Populated places established in 1821