Putnam County, Illinois
Putnam County | |
|---|---|
U.S. county | |
 Putnam County Courthouse, Hennepin | |
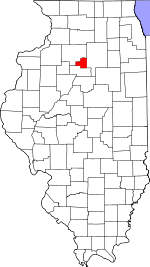 Location within the U.S. state of Illinois | |
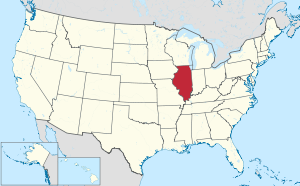 Illinois's location within the U.S. | |
| Coordinates: 41°12′N 89°17′W / 41.2°N 89.28°W | |
| Country | |
| State | |
| Founded | 1825 |
| Named for | Israel Putnam |
| Seat | Hennepin |
| Largest village | Granville |
| Area | |
| • Total | 172 sq mi (450 km2) |
| • Land | 160 sq mi (400 km2) |
| • Water | 12 sq mi (30 km2) 7.0% |
| Population (2010) | |
| • Total | 6,006 |
| • Estimate (2018) | 5,740 |
| • Density | 35/sq mi (13/km2) |
| Time zone | UTC−6 (Central) |
| • Summer (DST) | UTC−5 (CDT) |
| Congressional district | 16th |
| Website | www |

Putnam County is the least extensive county in the U.S. state of Illinois. According to the 2010 census, it had a population of 6,006.[1] The county seat is Hennepin.[2] The county was formed in 1825 out of Fulton County and named after Israel Putnam,[3] who was a general in the American Revolution. Putnam County is part of the Ottawa, IL Micropolitan Statistical Area.
Geography[]
According to the U.S. Census Bureau, the county has a total area of 172 square miles (450 km2), of which 160 square miles (410 km2) is land and 12 square miles (31 km2) (7.0%) is water.[4] It is the smallest county in Illinois by area.
Climate and weather[]
| Hennepin, Illinois | ||||||||||||||||||||||||||||||||||||||||||||||||||||||||||||
|---|---|---|---|---|---|---|---|---|---|---|---|---|---|---|---|---|---|---|---|---|---|---|---|---|---|---|---|---|---|---|---|---|---|---|---|---|---|---|---|---|---|---|---|---|---|---|---|---|---|---|---|---|---|---|---|---|---|---|---|---|
| Climate chart (explanation) | ||||||||||||||||||||||||||||||||||||||||||||||||||||||||||||
| ||||||||||||||||||||||||||||||||||||||||||||||||||||||||||||
| ||||||||||||||||||||||||||||||||||||||||||||||||||||||||||||
In recent years, average temperatures in the county seat of Hennepin have ranged from a low of 13 °F (−11 °C) in January to a high of 86 °F (30 °C) in July, although a record low of −30 °F (−34 °C) was recorded in January 1999 and a record high of 104 °F (40 °C) was recorded in June 1988. Average monthly precipitation ranged from 1.14 inches (29 mm) in January to 4.32 inches (110 mm) in August.[5]
Major highways[]
 Interstate 180
 Illinois Route 18
 Illinois Route 26
 Illinois Route 29
 Illinois Route 71
 Illinois Route 89
Adjacent counties[]
- Bureau County (northwest)
- LaSalle County (east)
- Marshall County (south)
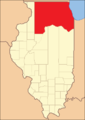
Putnam County at the time of its creation in 1825
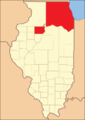
The county split in two portions, 1827-1831

Putnam County between 1831 and 1837
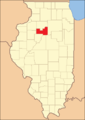
Putnam between 1837 and 1839
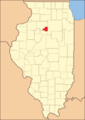
Putnam in 1839, reduced to its present borders


Demographics[]
| Historical population | |||
|---|---|---|---|
| Census | Pop. | %± | |
| 1840 | 2,131 | — | |
| 1850 | 3,924 | 84.1% | |
| 1860 | 5,587 | 42.4% | |
| 1870 | 6,280 | 12.4% | |
| 1880 | 5,554 | −11.6% | |
| 1890 | 4,730 | −14.8% | |
| 1900 | 4,746 | 0.3% | |
| 1910 | 7,561 | 59.3% | |
| 1920 | 7,579 | 0.2% | |
| 1930 | 5,235 | −30.9% | |
| 1940 | 5,289 | 1.0% | |
| 1950 | 4,746 | −10.3% | |
| 1960 | 4,570 | −3.7% | |
| 1970 | 5,007 | 9.6% | |
| 1980 | 6,085 | 21.5% | |
| 1990 | 5,730 | −5.8% | |
| 2000 | 6,086 | 6.2% | |
| 2010 | 6,006 | −1.3% | |
| 2018 (est.) | 5,740 | [6] | −4.4% |
| U.S. Decennial Census[7] 1790-1960[8] 1900-1990[9] 1990-2000[10] 2010-2017[1] | |||
As of the 2010 census, there were 6,006 people, 2,509 households, and 1,734 families residing in the county.[11] The population density was 37.5 inhabitants per square mile (14.5/km2). There were 3,074 housing units at an average density of 19.2 per square mile (7.4/km2).[4] The racial makeup of the county was 96.6% white, 0.5% black or African American, 0.2% Asian, 0.1% American Indian, 1.4% from other races, and 1.1% from two or more races. Those of Hispanic or Latino origin made up 4.2% of the population.[11] In terms of ancestry, 46.5% were German, 16.7% were Irish, 16.3% were Italian, 10.9% were Polish, 10.1% were English, 5.1% were Swedish, and 3.5% were American.[12]
Of the 2,509 households, 27.7% had children under the age of 18 living with them, 57.6% were married couples living together, 7.2% had a female householder with no husband present, 30.9% were non-families, and 26.0% of all households were made up of individuals. The average household size was 2.39 and the average family size was 2.85. The median age was 45.2 years.[11]
The median income for a household in the county was $56,458 and the median income for a family was $68,875. Males had a median income of $50,205 versus $31,886 for females. The per capita income for the county was $27,004. About 6.2% of families and 10.9% of the population were below the poverty line, including 21.8% of those under age 18 and 5.4% of those age 65 or over.[13]
Communities[]
Villages[]
Unincorporated communities[]
- Florid
- Moronts
- Mount Palatine (partially in LaSalle)
- Putnam
- Walnut Grove
Townships[]
Putnam County is divided into four townships:
Politics[]
This section needs additional citations for verification. (June 2021) |
Prior to 1988, Putnam County was a Republican Party stronghold in presidential elections, backing the Republican candidate in all but three elections from 1892 to 1984. From 1988 to 2012, the county consistently backed Democratic Party presidential candidates, but none fared better than Illinois resident Barack Obama's 56.9% in 2008. However, he failed to win a majority of the county's votes four years later despite winning it overall in his 2012 reelection bid. This foreshadowed what was to come in the 2016 election, as the county swung 21.8 points Republican to back Donald Trump over Illinois-born Hillary Clinton by a margin of 19.9%.[14]
See also[]
- National Register of Historic Places listings in Putnam County
- The 25th Annual Putnam County Spelling Bee
References[]
- ^ Jump up to: a b "State & County QuickFacts". United States Census Bureau. Archived from the original on September 5, 2015. Retrieved July 8, 2014.
- ^ "Find a County". National Association of Counties. Retrieved June 7, 2011.
- ^ "About Putnam County". Putnam County, Illinois. Retrieved July 27, 2012.
- ^ Jump up to: a b "Population, Housing Units, Area, and Density: 2010 - County". United States Census Bureau. Archived from the original on February 12, 2020. Retrieved July 12, 2015.
- ^ Jump up to: a b "Monthly Averages for Hennepin, Illinois". The Weather Channel. Retrieved January 27, 2011.
- ^ "Population and Housing Unit Estimates". Retrieved November 2, 2019.
- ^ "U.S. Decennial Census". United States Census Bureau. Retrieved July 8, 2014.
- ^ "Historical Census Browser". University of Virginia Library. Retrieved July 8, 2014.
- ^ "Population of Counties by Decennial Census: 1900 to 1990". United States Census Bureau. Retrieved July 8, 2014.
- ^ "Census 2000 PHC-T-4. Ranking Tables for Counties: 1990 and 2000" (PDF). United States Census Bureau. Retrieved July 8, 2014.
- ^ Jump up to: a b c "DP-1 Profile of General Population and Housing Characteristics: 2010 Demographic Profile Data". United States Census Bureau. Archived from the original on February 13, 2020. Retrieved July 12, 2015.
- ^ "DP02 SELECTED SOCIAL CHARACTERISTICS IN THE UNITED STATES – 2006-2010 American Community Survey 5-Year Estimates". United States Census Bureau. Archived from the original on February 13, 2020. Retrieved July 12, 2015.
- ^ "DP03 SELECTED ECONOMIC CHARACTERISTICS – 2006-2010 American Community Survey 5-Year Estimates". United States Census Bureau. Archived from the original on February 13, 2020. Retrieved July 12, 2015.
- ^ "Here's a map of the US counties that flipped to Trump from Democrats". www.cnbc.com. Retrieved October 19, 2019.
- ^ Leip, David. "Dave Leip's Atlas of U.S. Presidential Elections". uselectionatlas.org. Retrieved November 12, 2018.
External links[]
| show Places adjacent to Putnam County, Illinois |
|---|
| show Municipalities and communities of Putnam County, Illinois, United States |
|---|

| show Authority control |
|---|
- Illinois counties
- Putnam County, Illinois
- 1825 establishments in Illinois
- Ottawa, IL Micropolitan Statistical Area
- Populated places established in 1825