Brown County, Illinois
Brown County | |
|---|---|
U.S. county | |
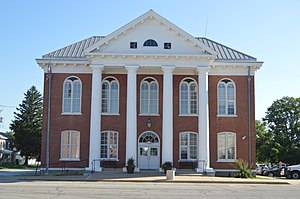 Brown County Courthouse in Mount Sterling | |
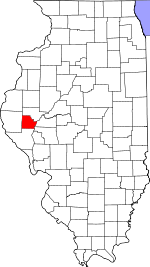 Location within the U.S. state of Illinois | |
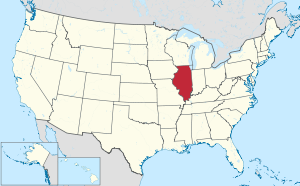 Illinois's location within the U.S. | |
| Coordinates: 39°57′N 90°45′W / 39.95°N 90.75°W | |
| Country | |
| State | |
| Founded | 1839 |
| Named for | Jacob Brown |
| Seat | Mount Sterling |
| Largest city | Mount Sterling |
| Area | |
| • Total | 307 sq mi (800 km2) |
| • Land | 306 sq mi (790 km2) |
| • Water | 1.6 sq mi (4 km2) 0.5% |
| Population (2010) | |
| • Total | 6,937 |
| • Estimate (2019) | 6,578 |
| • Density | 23/sq mi (8.7/km2) |
| Time zone | UTC−6 (Central) |
| • Summer (DST) | UTC−5 (CDT) |
| Congressional district | 18th |
| Website | https://www.browncoil.org |

Brown County is a county located in the U.S. state of Illinois. As of the 2010 census, the population was 6,937.[1] Its county seat is Mount Sterling.[2]
Siloam Springs State Park is located partly in this county.
History[]
Brown County was formed out of Schuyler County in 1839. It is named in honor of U.S. General Jacob Brown, who defeated the British at the Battle of Sackett's Harbor in 1813.
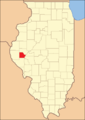
Brown County at the time of its creation in 1839

Geography[]
According to the U.S. Census Bureau, the county has a total area of 307 square miles (800 km2), of which 306 square miles (790 km2) is land and 1.6 square miles (4.1 km2) (0.5%) is water.[3] The Illinois River flows along part of the county's eastern border.
Adjacent counties[]
- Schuyler County - north
- Cass County - east
- Morgan County - southeast
- Pike County - south
- Adams County - west
Major highways[]
 US Route 24
 Illinois Route 99
 Illinois Route 107
Climate and weather[]
| Mount Sterling, Illinois | ||||||||||||||||||||||||||||||||||||||||||||||||||||||||||||
|---|---|---|---|---|---|---|---|---|---|---|---|---|---|---|---|---|---|---|---|---|---|---|---|---|---|---|---|---|---|---|---|---|---|---|---|---|---|---|---|---|---|---|---|---|---|---|---|---|---|---|---|---|---|---|---|---|---|---|---|---|
| Climate chart (explanation) | ||||||||||||||||||||||||||||||||||||||||||||||||||||||||||||
| ||||||||||||||||||||||||||||||||||||||||||||||||||||||||||||
| ||||||||||||||||||||||||||||||||||||||||||||||||||||||||||||
In recent years, average temperatures in the county seat of Mount Sterling have ranged from a low of 15 °F (−9 °C) in January to a high of 87 °F (31 °C) in July, although a record low of −26 °F (−32 °C) was recorded in February 1905 and a record high of 113 °F (45 °C) was recorded in July 1936. Average monthly precipitation ranged from 1.55 inches (39 mm) in January to 5.14 inches (131 mm) in May.[4]
Demographics[]

| Historical population | |||
|---|---|---|---|
| Census | Pop. | %± | |
| 1840 | 4,183 | — | |
| 1850 | 7,198 | 72.1% | |
| 1860 | 9,938 | 38.1% | |
| 1870 | 12,205 | 22.8% | |
| 1880 | 13,041 | 6.8% | |
| 1890 | 11,951 | −8.4% | |
| 1900 | 11,557 | −3.3% | |
| 1910 | 10,397 | −10.0% | |
| 1920 | 9,336 | −10.2% | |
| 1930 | 7,892 | −15.5% | |
| 1940 | 8,053 | 2.0% | |
| 1950 | 7,132 | −11.4% | |
| 1960 | 6,210 | −12.9% | |
| 1970 | 5,586 | −10.0% | |
| 1980 | 5,411 | −3.1% | |
| 1990 | 5,836 | 7.9% | |
| 2000 | 6,950 | 19.1% | |
| 2010 | 6,937 | −0.2% | |
| 2019 (est.) | 6,578 | [5] | −5.2% |
| U.S. Decennial Census[6] 1790-1960[7] 1900-1990[8] 1990-2000[9] 2010-2017[1] | |||
As of the 2010 United States Census, there were 6,937 people, 2,099 households, and 1,346 families living in the county.[10] The population density was 22.7 inhabitants per square mile (8.8/km2). There were 2,462 housing units at an average density of 8.1 per square mile (3.1/km2).[3] The racial makeup of the county was 76.1% white, 18.5% black or African American, 0.2% Asian, 0.2% American Indian, 4.4% from other races, and 0.6% from two or more races. Those of Hispanic or Latino origin made up 5.8% of the population.[10] In terms of ancestry, 25.5% were German, 15.6% were American, 12.7% were Irish, and 6.1% were English.[11]
Of the 2,099 households, 28.4% had children under the age of 18 living with them, 51.3% were married couples living together, 8.6% had a female householder with no husband present, 35.9% were non-families, and 32.2% of all households were made up of individuals. The average household size was 2.30 and the average family size was 2.88. The median age was 37.3 years.[10]
The median income for a household in the county was $38,696 and the median income for a family was $50,341. Males had a median income of $34,648 versus $27,288 for females. The per capita income for the county was $17,133. About 9.9% of families and 12.0% of the population were below the poverty line, including 15.0% of those under age 18 and 9.2% of those age 65 or over.[12]
The Illinois state prison, Western Illinois Correctional Center, located south east of Mount Sterling, has an average daily population of 2,066. The all-male population and racial makeup of the prison is so large, compared to the rest of the county, that it skews the census demographic data. This is evidenced by the lopsided age pyramid.[1]
Communities[]
City[]
- Mount Sterling (seat)
Villages[]
- Mound Station
- Ripley
- Versailles
- Cooperstown
Townships[]
Brown County is divided into these nine townships:
Unincorporated Communities[]
Politics[]
Brown County is located in Illinois's 18th Congressional District and is currently represented by Republican Darin LaHood. For the Illinois House of Representatives, the county is located in the 93rd district and is currently represented by Republican Norine Hammond. The county is located in the 47th district of the Illinois Senate, and is currently represented by Republican Jil Tracy.
Brown County is part of the German-settled area of western Central Illinois and the Missouri Rhineland centred on the St. Louis metropolitan area. This region was opposed both to southern plantation owners and socially liberal Yankees and consequently voted against the majority of people in their state. Brown County voted for the Democratic candidate in every presidential election from at least 1840 through 1948, with the sole exception of the 1928 election when the county voted for the Republican candidate Herbert Hoover. From 1952 to 2020, Democrats have carried Brown County only three times (1964, 1976, and 1992) and have won a majority of the vote only once (1964).
Education[]
- Brown County Community Unit School District 1
- Meredosia-Chambersburg Community Unit School District 11
- Southeastern Community Unit School District 337
See also[]
- National Register of Historic Places listings in Brown County, Illinois
References[]
- Specific
- ^ Jump up to: a b "State & County QuickFacts". United States Census Bureau. Archived from the original on July 7, 2011. Retrieved July 3, 2014.
- ^ "Find a County". National Association of Counties. Archived from the original on May 31, 2011. Retrieved June 7, 2011.
- ^ Jump up to: a b "Population, Housing Units, Area, and Density: 2010 - County". United States Census Bureau. Archived from the original on February 12, 2020. Retrieved July 11, 2015.
- ^ Jump up to: a b "Monthly Averages for Mount Sterling, Illinois". The Weather Channel. Retrieved January 27, 2011.
- ^ "County Population Totals: 2010-2019". Retrieved March 3, 2021.
- ^ "U.S. Decennial Census". United States Census Bureau. Retrieved July 3, 2014.
- ^ "Historical Census Browser". University of Virginia Library. Retrieved July 3, 2014.
- ^ "Population of Counties by Decennial Census: 1900 to 1990". United States Census Bureau. Retrieved July 3, 2014.
- ^ "Census 2000 PHC-T-4. Ranking Tables for Counties: 1990 and 2000" (PDF). United States Census Bureau. Retrieved July 3, 2014.
- ^ Jump up to: a b c "DP-1 Profile of General Population and Housing Characteristics: 2010 Demographic Profile Data". United States Census Bureau. Archived from the original on February 13, 2020. Retrieved July 11, 2015.
- ^ "DP02 SELECTED SOCIAL CHARACTERISTICS IN THE UNITED STATES – 2006-2010 American Community Survey 5-Year Estimates". United States Census Bureau. Archived from the original on February 13, 2020. Retrieved July 11, 2015.
- ^ "DP03 SELECTED ECONOMIC CHARACTERISTICS – 2006-2010 American Community Survey 5-Year Estimates". United States Census Bureau. Archived from the original on February 13, 2020. Retrieved July 11, 2015.
- ^ Leip, David. "Dave Leip's Atlas of U.S. Presidential Elections". uselectionatlas.org. Retrieved October 29, 2018.
- General
- United States Census Bureau 2007 TIGER/Line Shapefiles
- United States Board on Geographic Names (GNIS)
- United States National Atlas
External links[]
 Media related to Brown County, Illinois at Wikimedia Commons
| show Places adjacent to Brown County, Illinois |
|---|
| show Municipalities and communities of Brown County, Illinois, United States |
|---|

| show Authority control |
|---|
- Illinois counties
- Brown County, Illinois
- 1839 establishments in Illinois
- Populated places established in 1839