List of U.S. states and territories by African-American population
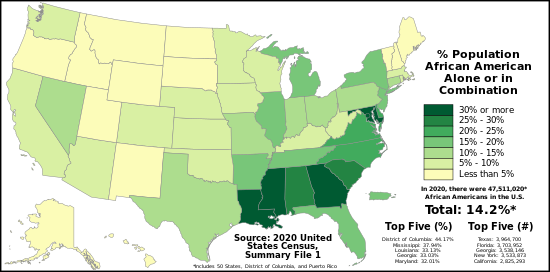

The following is a list of U.S. states, territories, and the District of Columbia ranked by the proportion of African Americans of full or partial descent including those of Hispanic origin, in the population. Considering only those who marked black and no other race in combination as in the first table, the percentage was 12.4% in 2020, down from 12.6% in 2010.[1] Considering those who marked black and any other race in combination as in the second table the percentage increased from 13.6% to 14.2%.
2020 census (single race)[]
| % Black or African- American alone[2] |
Rank | State or territory | Black or African-American alone Population (2020) |
|---|---|---|---|
| 76.0% | 1 | 80,908[3] | |
| 41.4% | 2 | 285,810 | |
| 36.6% | 3 | 1,084,481 | |
| 31.4% | 4 | 1,464,023 | |
| 31.0% | 5 | 3,320,513 | |
| 29.5% | 6 | 1,820,472 | |
| 25.8% | 7 | 1,296,162 | |
| 25.0% | 8 | 1,280,531 | |
| 22.1% | 9 | 218,899 | |
| 20.5% | 10 | 2,140,217 | |
| 18.6% | 11 | 1,607,581 | |
| 15.8% | 12 | 1,092,948 | |
| 15.1% | 13 | 3,246,381 | |
| 15.1% | 14 | 453,783 | |
| 14.8% | 15 | 2,986,172 | |
| 14.1% | 16 | 1,808,271 | |
| 13.7% | 17 | 1,376,579 | |
| 13.1% | 18 | 1,219,770 | |
| 12.5% | 19 | 1,478,781 | |
| 12.4% | − | 41,104,200 | |
| 12.2% | 20 | 3,552,997 | |
| 11.4% | 21 | 699,840 | |
| 10.9% | 22 | 1,423,169 | |
| 10.8% | 23 | 388,675 | |
| 9.8% | 24 | 304,739 | |
| 9.6% | 25 | 648,513 | |
| 8.0% | 26 | 362,417 | |
| 7.3% | 27 | 289,961 | |
| 7.0% | 28 | 494,029 | |
| 7.0% | 29 | 398,434 | |
| 7.0% | 30 | 228,711 | |
| 6.4% | 31 | 376,256 | |
| 5.7% | 32 | 2,237,044 | |
| 5.7% | 33 | 168,809 | |
| 5.7% | 34 | 62,168 | |
| 4.9% | 35 | 96,535 | |
| 4.7% | 36 | 339,150 | |
| 4.1% | 37 | 234,828 | |
| 4.1% | 38 | 131,972 | |
| 4.0% | 39 | 307,565 | |
| 3.9% | 40 | 30,067 | |
| 3.7% | 41 | 65,813 | |
| 3.0% | 42 | 21,898 | |
| 2.2% | 43 | 45,904 | |
| 2.0% | 44 | 82,655 | |
| 2.0% | 45 | 17,842 | |
| 1.9% | 46 | 25,752 | |
| 1.6% | 47 | 23,417 | |
| 1.5% | 48 | 20,127 | |
| 1.4% | 49 | 9,034 | |
| 1.2% | 50 | 40,058 | |
| 1.0%[4] | 51 | 1,540[4] | |
| 0.9% | 52 | 15,726 | |
| 0.9% | 53 | 5,232 | |
| 0.5% | 54 | 5,484 | |
| 0.1%[5] | 55 | 55[5] | |
| 0.02%[6] | 56 | 13[6] |
African-American proportion of state and territory populations (1790–2020)[]
| State/Territory | 1790 | 1800 | 1810 | 1820 | 1830 | 1840 | 1850 | 1860 | 1870 | 1880 | 1890 | 1900 | 1910 | 1920 | 1930 | 1940 | 1950 | 1960 | 1970 | 1980 | 1990 | 2000 | 2010 | 2020 |
|---|---|---|---|---|---|---|---|---|---|---|---|---|---|---|---|---|---|---|---|---|---|---|---|---|
| 19.3% | 18.9% | 19.0% | 18.4% | 18.1% | 16.8% | 15.7% | 14.1% | 12.7% | 13.1% | 11.9% | 11.6% | 10.7% | 9.9% | 9.7% | 9.8% | 10.0% | 10.5% | 11.1% | 11.7% | 12.1% | 12.9% | 13.6% | 14.2% | |
| 41.4% | 29.0% | 33.2% | 38.5% | 43.3% | 44.7% | 45.4% | 47.7% | 47.5% | 44.8% | 45.2% | 42.5% | 38.4% | 35.7% | 34.7% | 32.0% | 30.0% | 26.2% | 25.6% | 25.3% | 26.0% | 26.3% | 26.8% | ||
| 0.3% | 0.3% | 0.2% | 0.2% | 0.2% | 3.0% | 3.0% | 3.4% | 4.1% | 4.3% | 4.7% | 4.8% | |||||||||||||
| 0.02% | 0.04% | 0.02% | ||||||||||||||||||||||
| 0.3% | 0.3% | 0.4% | 1.5% | 1.5% | 1.0% | 2.4% | 2.5% | 3.0% | 3.5% | 3.3% | 3.0% | 2.8% | 3.0% | 3.6% | 5.0% | 6.2% | ||||||||
| 13.0% | 11.7% | 15.5% | 20.9% | 22.7% | 25.6% | 25.2% | 26.3% | 27.4% | 28.0% | 28.1% | 27.0% | 25.8% | 24.8% | 22.3% | 21.8% | 18.3% | 16.3% | 15.9% | 16.0% | 16.1% | 16.5% | |||
| 1.0% | 1.1% | 0.8% | 0.7% | 0.9% | 0.7% | 0.9% | 1.1% | 1.4% | 1.8% | 4.4% | 5.6% | 7.0% | 7.7% | 7.4% | 7.4% | 7.2% | 7.1% | |||||||
| 0.1% | 1.1% | 1.3% | 1.5% | 1.6% | 1.4% | 1.2% | 1.1% | 1.1% | 1.5% | 2.3% | 3.0% | 3.5% | 4.0% | 4.4% | 5.0% | 5.5% | ||||||||
| 2.3% | 2.5% | 2.6% | 2.9% | 2.7% | 2.6% | 2.1% | 1.9% | 1.8% | 1.9% | 1.6% | 1.7% | 1.4% | 1.5% | 1.8% | 1.9% | 2.7% | 4.2% | 6.0% | 7.0% | 8.3% | 10.0% | 11.3% | 13.0% | |
| 21.6% | 22.4% | 23.8% | 24.0% | 24.9% | 25.0% | 22.2% | 19.3% | 18.2% | 18.0% | 16.8% | 16.6% | 15.4% | 13.6% | 13.7% | 13.5% | 13.7% | 13.6% | 14.3% | 16.1% | 16.9% | 20.1% | 22.9% | 24.7% | |
| 30.4% | 33.1% | 31.2% | 30.1% | 29.1% | 26.6% | 19.1% | 33.0% | 33.6% | 32.8% | 31.1% | 28.5% | 25.1% | 27.1% | 28.2% | 35.0% | 53.9% | 71.1% | 70.3% | 65.8% | 61.3% | 52.2% | 44.2% | ||
| 47.1% | 48.7% | 46.0% | 44.6% | 48.8% | 47.0% | 42.5% | 43.7% | 41.0% | 34.0% | 29.4% | 27.1% | 21.8% | 17.8% | 15.3% | 13.8% | 13.6% | 15.5% | 17.0% | 17.2% | |||||
| 35.9% | 37.1% | 42.5% | 44.4% | 42.6% | 41.0% | 42.4% | 44.0% | 46.0% | 47.0% | 46.7% | 46.7% | 45.1% | 41.7% | 36.8% | 34.7% | 30.9% | 28.5% | 25.9% | 26.8% | 27.0% | 29.2% | 31.5% | 33.0% | |
| 2.37% | 1.02% | 0.96% | ||||||||||||||||||||||
| 0.2% | 0.4% | 0.1% | 0.2% | 0.1% | 0.5% | 0.8% | 1.0% | 1.8% | 2.5% | 2.8% | 2.9% | 3.2% | ||||||||||||
| 0.4% | 0.2% | 0.2% | 0.2% | 0.2% | 0.2% | 0.2% | 0.1% | 0.2% | 0.2% | 0.3% | 0.3% | 0.3% | 0.6% | 1.0% | 1.5% | |||||||||
| 7.4% | 6.4% | 2.5% | 1.5% | 0.8% | 0.6% | 0.4% | 1.1% | 1.5% | 1.5% | 1.8% | 1.9% | 2.8% | 4.3% | 4.9% | 7.4% | 10.3% | 12.8% | 14.7% | 14.8% | 15.6% | 15.4% | 15.5% | ||
| 4.4% | 2.6% | 1.0% | 1.1% | 1.0% | 1.1% | 0.8% | 1.5% | 2.0% | 2.1% | 2.3% | 2.2% | 2.8% | 3.5% | 3.6% | 4.4% | 5.8% | 6.9% | 7.6% | 7.8% | 8.8% | 10.1% | 11.2% | ||
| 0.4% | 0.2% | 0.2% | 0.5% | 0.6% | 0.6% | 0.6% | 0.7% | 0.8% | 0.7% | 0.7% | 0.8% | 0.9% | 1.2% | 1.4% | 1.7% | 2.5% | 3.7% | 5.4% | ||||||
| 0.6% | 4.7% | 4.3% | 3.5% | 3.5% | 3.2% | 3.3% | 3.5% | 3.6% | 3.8% | 4.2% | 4.8% | 5.3% | 5.8% | 6.3% | 7.1% | 7.6% | ||||||||
| 17.0% | 18.6% | 20.2% | 22.9% | 24.7% | 24.3% | 22.5% | 20.4% | 16.8% | 16.5% | 14.4% | 13.3% | 11.4% | 9.8% | 8.6% | 7.5% | 6.9% | 7.1% | 7.2% | 7.1% | 7.1% | 7.7% | 8.7% | 9.7% | |
| 55.2% | 51.8% | 58.5% | 55.0% | 50.7% | 49.5% | 50.1% | 51.5% | 50.0% | 47.1% | 43.1% | 38.9% | 36.9% | 35.9% | 32.9% | 31.9% | 29.8% | 29.4% | 30.8% | 32.9% | 32.8% | 33.1% | |||
| 0.6% | 0.5% | 0.4% | 0.3% | 0.3% | 0.3% | 0.2% | 0.2% | 0.3% | 0.2% | 0.2% | 0.2% | 0.2% | 0.2% | 0.1% | 0.2% | 0.1% | 0.3% | 0.3% | 0.3% | 0.4% | 0.7% | 1.6% | 2.7% | |
| 34.7% | 36.7% | 38.2% | 36.1% | 34.9% | 32.3% | 28.3% | 24.9% | 22.5% | 22.5% | 20.7% | 19.8% | 17.9% | 16.9% | 16.9% | 16.6% | 16.5% | 16.7% | 17.8% | 22.7% | 24.9% | 28.8% | 30.9% | 32.0% | |
| 1.4% | 1.5% | 1.4% | 1.3% | 1.2% | 1.2% | 0.9% | 0.8% | 1.0% | 1.0% | 1.0% | 1.1% | 1.1% | 1.2% | 1.2% | 1.3% | 1.6% | 2.2% | 3.1% | 3.9% | 5.0% | 6.3% | 7.8% | 9.5% | |
| 3.7% | 3.0% | 2.1% | 0.8% | 0.3% | 0.6% | 0.9% | 1.0% | 0.9% | 0.7% | 0.7% | 0.6% | 1.6% | 3.5% | 4.0% | 6.9% | 9.2% | 11.2% | 12.9% | 13.9% | 14.8% | 15.2% | 15.3% | ||
| 0.6% | 0.2% | 0.2% | 0.2% | 0.3% | 0.3% | 0.3% | 0.4% | 0.4% | 0.4% | 0.5% | 0.7% | 0.9% | 1.3% | 2.2% | 4.1% | 6.2% | 8.5% | |||||||
| 41.5% | 47.0% | 44.1% | 48.4% | 52.3% | 51.2% | 55.3% | 53.7% | 57.5% | 57.6% | 58.5% | 56.2% | 52.2% | 50.2% | 49.2% | 45.3% | 42.0% | 36.8% | 35.2% | 35.6% | 36.6% | 37.6% | 37.9% | ||
| 17.6% | 15.9% | 18.3% | 15.6% | 13.2% | 10.0% | 6.9% | 6.7% | 5.6% | 5.2% | 4.8% | 5.2% | 6.2% | 6.5% | 7.5% | 9.0% | 10.3% | 10.5% | 10.7% | 11.7% | 12.5% | 13.0% | |||
| 0.9% | 0.9% | 1.0% | 0.6% | 0.2% | 0.3% | 0.2% | 0.2% | 0.2% | 0.2% | 0.3% | 0.2% | 0.3% | 0.5% | 0.8% | 1.2% | |||||||||
| 0.3% | 0.6% | 0.5% | 0.8% | 0.6% | 0.6% | 1.0% | 1.0% | 1.1% | 1.5% | 2.1% | 2.7% | 3.1% | 3.6% | 4.4% | 5.4% | 6.4% | ||||||||
| 0.7% | 0.8% | 0.8% | 0.5% | 0.3% | 0.6% | 0.4% | 0.6% | 0.6% | 2.7% | 4.7% | 5.7% | 6.4% | 6.6% | 7.5% | 9.4% | 12.1% | ||||||||
| 0.6% | 0.5% | 0.5% | 0.3% | 0.2% | 0.2% | 0.2% | 0.2% | 0.2% | 0.2% | 0.2% | 0.2% | 0.1% | 0.1% | 0.2% | 0.1% | 0.1% | 0.3% | 0.3% | 0.4% | 0.6% | 1.0% | 1.7% | 2.4% | |
| 7.7% | 8.0% | 7.6% | 7.2% | 6.4% | 5.8% | 4.9% | 3.8% | 3.4% | 3.4% | 3.3% | 3.7% | 3.5% | 3.7% | 5.2% | 5.5% | 6.6% | 8.5% | 10.7% | 12.6% | 13.4% | 14.4% | 14.8% | 15.2% | |
| 0.0% | 0.1% | 0.2% | 0.8% | 1.2% | 0.8% | 0.5% | 1.6% | 0.7% | 0.9% | 1.2% | 1.8% | 1.9% | 1.8% | 2.0% | 2.3% | 2.8% | 3.2% | |||||||
| 7.6% | 5.3% | 4.2% | 2.9% | 2.3% | 2.1% | 1.6% | 1.3% | 1.2% | 1.3% | 1.2% | 1.4% | 1.5% | 1.9% | 3.3% | 4.2% | 6.2% | 8.4% | 11.9% | 13.7% | 15.9% | 17.0% | 17.2% | 17.5% | |
| 26.8% | 29.4% | 32.2% | 34.4% | 35.9% | 35.6% | 36.4% | 36.4% | 36.6% | 38.0% | 34.7% | 33.0% | 31.6% | 29.8% | 29.0% | 27.5% | 25.8% | 24.5% | 22.2% | 22.4% | 22.0% | 22.1% | 22.6% | 22.5% | |
| 1.0% | 0.3% | 0.2% | 0.1% | 0.1% | 0.1% | 0.1% | 0.0% | 0.0% | 0.1% | 0.4% | 0.4% | 0.6% | 0.8% | 1.6% | 4.4% | |||||||||
| 0.06% | 0.06% | 0.1% | ||||||||||||||||||||||
| 0.5% | 0.8% | 0.8% | 1.0% | 1.1% | 1.3% | 1.6% | 2.4% | 2.5% | 2.4% | 2.3% | 2.3% | 3.2% | 4.7% | 4.9% | 6.5% | 8.1% | 9.1% | 10.0% | 10.6% | 12.1% | 13.4% | 14.4% | ||
| 8.4% | 7.0% | 8.3% | 7.4% | 7.2% | 7.2% | 6.5% | 6.6% | 6.7% | 6.8% | 7.4% | 8.3% | 8.7% | 9.7% | |||||||||||
| 0.5% | 0.2% | 0.4% | 0.3% | 0.4% | 0.3% | 0.2% | 0.3% | 0.2% | 0.2% | 0.8% | 1.0% | 1.3% | 1.4% | 1.6% | 2.1% | 2.6% | 3.2% | |||||||
| 2.4% | 2.7% | 2.9% | 2.9% | 2.8% | 2.8% | 2.3% | 2.0% | 1.9% | 2.0% | 2.0% | 2.5% | 2.5% | 3.3% | 4.5% | 4.7% | 6.1% | 7.5% | 8.6% | 8.8% | 9.2% | 10.5% | 11.9% | 12.7% | |
| 10.9% | 14.8% | 17.5% | ||||||||||||||||||||||
| 6.3% | 5.3% | 4.8% | 4.3% | 3.7% | 3.0% | 2.5% | 2.3% | 2.3% | 2.3% | 2.1% | 2.1% | 1.8% | 1.7% | 1.4% | 1.5% | 1.8% | 2.1% | 2.7% | 2.9% | 3.9% | 5.5% | 7.4% | 9.1% | |
| 43.7% | 43.2% | 48.4% | 52.8% | 55.6% | 56.4% | 58.9% | 58.6% | 58.9% | 60.7% | 59.8% | 58.4% | 55.2% | 51.4% | 45.6% | 42.9% | 38.8% | 34.8% | 30.5% | 30.4% | 29.8% | 29.9% | 28.8% | 26.8% | |
| 0.0% | 0.6% | 0.3% | 0.2% | 0.1% | 0.1% | 0.1% | 0.1% | 0.1% | 0.1% | 0.2% | 0.2% | 0.3% | 0.5% | 0.9% | 1.8% | 3.0% | ||||||||
| 10.6% | 13.2% | 17.5% | 19.6% | 21.4% | 22.7% | 24.5% | 25.5% | 25.6% | 26.1% | 24.4% | 23.8% | 21.7% | 19.3% | 18.3% | 17.4% | 16.1% | 16.5% | 15.8% | 15.8% | 16.0% | 16.8% | 17.4% | 17.3% | |
| 27.5% | 30.3% | 31.0% | 24.7% | 21.8% | 20.4% | 17.7% | 15.9% | 14.7% | 14.4% | 12.7% | 12.4% | 12.5% | 12.0% | 11.9% | 12.0% | 12.6% | 13.6% | |||||||
| 0.4% | 0.1% | 0.1% | 0.2% | 0.3% | 0.2% | 0.3% | 0.3% | 0.2% | 0.2% | 0.4% | 0.5% | 0.6% | 0.6% | 0.7% | 1.1% | 1.6% | 2.1% | |||||||
| 0.3% | 0.4% | 0.3% | 0.4% | 0.3% | 0.3% | 0.2% | 0.2% | 0.3% | 0.3% | 0.3% | 0.2% | 0.5% | 0.2% | 0.2% | 0.1% | 0.1% | 0.1% | 0.2% | 0.2% | 0.3% | 0.7% | 1.5% | 2.2% | |
| 76.62% | 76.19% | 76.03% | ||||||||||||||||||||||
| 43.4% | 44.6% | 47.1% | 47.8% | 47.9% | 46.9% | 45.0% | 43.3% | 41.9% | 41.8% | 38.4% | 35.6% | 32.6% | 29.9% | 26.8% | 24.7% | 22.1% | 20.6% | 18.5% | 18.9% | 18.8% | 20.4% | 20.7% | 20.9% | |
| 0.3% | 0.9% | 0.4% | 0.4% | 0.5% | 0.5% | 0.5% | 0.4% | 0.4% | 1.3% | 1.7% | 2.1% | 2.6% | 3.1% | 4.4% | 4.8% | 5.8% | ||||||||
| 9.5% | 9.8% | 11.5% | 12.1% | 11.2% | 9.6% | 7.8% | 5.6% | 4.1% | 4.2% | 4.3% | 4.5% | 5.3% | 5.9% | 6.6% | 6.2% | 5.7% | 4.8% | 3.9% | 3.3% | 3.1% | 3.5% | 4.2% | 5.0% | |
| 1.2% | 1.8% | 0.6% | 0.2% | 0.2% | 0.2% | 0.2% | 0.1% | 0.1% | 0.1% | 0.2% | 0.4% | 0.4% | 0.8% | 1.9% | 2.9% | 3.9% | 5.0% | 6.1% | 7.1% | 7.7% | ||||
| 2.0% | 1.4% | 1.5% | 1.0% | 1.5% | 0.7% | 0.6% | 0.4% | 0.9% | 0.7% | 0.8% | 0.7% | 0.8% | 1.0% | 1.3% | 1.7% |
Free Blacks as a percentage out of the total Black population by U.S. region and U.S. state between 1790 and 1860[]
In 1865, all enslaved Blacks (African-Americans) in the United States were emancipated as a result of the Thirteenth Amendment. However, some U.S. states had previously emancipated some or all of their Black population. The table below shows the percentage of free Blacks as a percentage of the total Black population in various U.S. regions and U.S. states between 1790 and 1860 (the blank areas on the chart below mean that there is no data for those specific regions or states in those specific years).
| State/territory | 1790 | 1800 | 1810 | 1820 | 1830 | 1840 | 1850 | 1860 |
|---|---|---|---|---|---|---|---|---|
| 7.9% | 10.8% | 13.5% | 13.2% | 13.7% | 13.4% | 11.9% | 11.0% | |
| Northeast | 40.1% | 56.2% | 73.5% | 83.7% | 97.8% | 99.5% | 99.8% | 100.0% |
| Midwest | 78.7% | 52.4% | 38.0% | 37.7% | 34.4% | 35.5% | 37.6% | |
| South | 4.7% | 6.7% | 8.5% | 8.2% | 8.4% | 8.1% | 7.0% | 6.3% |
| West | 97.9% | 99.4% | ||||||
| 4.4% | 2.2% | 1.3% | 1.3% | 0.8% | 0.7% | 0.6% | ||
| 100.0% | ||||||||
| 1.4% | 3.5% | 3.0% | 2.3% | 1.3% | 0.1% | |||
| 100.0% | 100.0% | |||||||
| 100.0% | ||||||||
| 50.4% | 84.9% | 95.4% | 98.8% | 99.7% | 99.8% | 100.0% | 100.0% | |
| 30.5% | 57.3% | 75.9% | 74.2% | 82.8% | 86.7% | 88.8% | 91.7% | |
| 16.2% | 30.7% | 37.9% | 50.5% | 66.2% | 73.2% | 77.8% | ||
| 5.2% | 3.1% | 2.3% | 1.5% | |||||
| 1.3% | 1.7% | 1.7% | 1.2% | 1.1% | 1.0% | 0.8% | 0.8% | |
| 41.5% | 78.5% | 33.3% | 68.7% | 91.6% | 100.0% | 100.0% | ||
| 75.7% | 62.4% | 86.6% | 99.9% | 100.0% | 100.0% | 100.0% | ||
| 91.5% | 100.0% | 100.0% | ||||||
| 99.7% | ||||||||
| 0.9% | 1.8% | 2.1% | 2.1% | 2.9% | 3.9% | 4.5% | 4.5% | |
| 18.0% | 13.2% | 13.2% | 13.1% | 6.7% | 5.3% | |||
| 100.0% | 100.0% | 100.0% | 100.0% | 99.8% | 100.0% | 100.0% | 100.0% | |
| 7.2% | 15.6% | 23.3% | 27.0% | 33.9% | 40.9% | 45.3% | 49.1% | |
| 100.0% | 100.0% | 100.0% | 100.0% | 100.0% | 100.0% | 100.0% | 100.0% | |
| 100.0% | 83.3% | 100.0% | 99.6% | 100.0% | 100.0% | 100.0% | ||
| 100.0% | 100.0% | |||||||
| 5.0% | 1.2% | 1.4% | 0.8% | 0.7% | 0.3% | 0.2% | ||
| 17.4% | 3.3% | 2.2% | 2.6% | 2.9% | 3.0% | |||
| 81.7% | ||||||||
| 100.0% | ||||||||
| 79.9% | 100.0% | 100.0% | 100.0% | 99.5% | 99.8% | 100.0% | 100.0% | |
| 19.5% | 26.2% | 42.0% | 62.2% | 89.0% | 96.9% | 99.0% | 99.9% | |
| 100.0% | 100.0% | |||||||
| 17.9% | 33.3% | 62.8% | 74.4% | 99.8% | 100.0% | 100.0% | 100.0% | |
| 4.7% | 5.0% | 5.7% | 6.7% | 7.4% | 8.5% | 8.7% | 8.4% | |
| 100.0% | 100.0% | 100.0% | 99.9% | 100.0% | 100.0% | 100.0% | ||
| 100.0% | 100.0% | |||||||
| 63.6% | 89.5% | 96.6% | 99.3% | 98.9% | 99.9% | 100.0% | 100.0% | |
| 78.2% | 89.7% | 97.1% | 98.7% | 99.5% | 99.8% | 100.0% | 100.0% | |
| 1.7% | 2.1% | 2.3% | 2.6% | 2.4% | 2.5% | 2.3% | 2.4% | |
| N/A[a] | ||||||||
| 9.6% | 2.2% | 2.9% | 3.3% | 3.1% | 2.9% | 2.6% | 2.6% | |
| 0.7% | 0.2% | |||||||
| 48.0% | 50.8% | |||||||
| 100.0% | 100.0% | 100.0% | 100.0% | 100.0% | 100.0% | 100.0% | 100.0% | |
| 4.1% | 5.6% | 7.3% | 8.2% | 9.3% | 10.1% | 10.2% | 10.5% | |
| 100.0% | 100.0% | |||||||
| 11.6% | 6.8% | 10.5% | 8.5% | 10.9% | 14.1% | 13.1% | 13.1% | |
| 100.0% | 51.6% | 94.4% | 100.0% | 100.0% | ||||
a^ There were no Blacks at all—either free or enslaved—in South Dakota in 1860.[13]
See also[]
- African American neighborhoods
- List of African American neighborhoods
- List of U.S. cities with large African-American populations
- List of U.S. counties with African-American majority populations
- List of U.S. metropolitan areas with large African-American populations
- Black Southerners
Notes[]
References[]
- ^ "Race and Ethnicity in the United States: 2010 Census and 2020 Census". Archived from the original on 15 August 2021. Retrieved 6 September 2021.
- ^ "Archived copy". Archived from the original on 2021-04-29. Retrieved 2020-12-25.
{{cite web}}: CS1 maint: archived copy as title (link) - ^ https://factfinder.census.gov/faces/tableservices/jsf/pages/productview.xhtml?pid=DEC_10_VISF_P3&prodType=table Archived 2020-02-12 at archive.today American FactFinder. Race; Total Population — 2010 U.S. Virgin Islands Summary File. Retrieved October 26, 2018.
- ^ a b https://factfinder.census.gov/faces/tableservices/jsf/pages/productview.xhtml?pid=DEC_10_GUSF_P3&prodType=table Archived 2020-02-14 at archive.today American FactFinder. Ethnic Origin or Race. Total Population - Guam 2010 Summary File. Retrieved October 26, 2018.
- ^ a b https://factfinder.census.gov/faces/tableservices/jsf/pages/productview.xhtml?pid=DEC_10_MPSF_P3&prodType=table Archived 2020-02-14 at archive.today American FactFinder. Ethnic Origin or Race. Total population - 2010 Commonwealth of the Northern Mariana Islands Summary File. Retrieved October 26, 2018.
- ^ a b https://factfinder.census.gov/faces/tableservices/jsf/pages/productview.xhtml?pid=DEC_10_ASSF_P3&prodType=table Archived 2020-02-14 at archive.today American FactFinder. Ethnic Origin or Race. Total population — 2010 American Samoa Summary File. Retrieved October 26, 2018.
- ^ "Historical Census Statistics on Population Totals By Race, 1790 to 1990, and By Hispanic Origin, 1970 to 1990, For The United States, Regions, Divisions, and States". Census.gov. Archived from the original on July 25, 2008. Retrieved September 15, 2012.
- ^ "Powered by Google Docs". Archived from the original on December 21, 2013. Retrieved September 15, 2012.
- ^ "Powered by Google Docs". Archived from the original on October 20, 2021. Retrieved September 15, 2012.
- ^ "Race and Ethnicity in the United States". United States Census Bureau. August 12, 2021. Archived from the original on August 15, 2021. Retrieved August 23, 2021.
- ^ "The Black Population: 2000" (PDF). Retrieved 10 February 2022.
- ^ "The Black Population: 2010" (PDF). Retrieved 10 February 2022.
- ^ a b "Population Division Working Paper No. 56" (PDF). Archived (PDF) from the original on 2018-09-30. Retrieved 2018-08-17.
African Americans | |||||
|---|---|---|---|---|---|
| History |
| ||||
| Culture |
| ||||
| Notable people |
| ||||
| Education, science and technology |
| ||||
| Religion |
| ||||
| Political movements |
| ||||
Civic and economic groups |
| ||||
| Sports |
| ||||
| Ethnic subdivisions | |||||
| Demographics | |||||
| Languages |
| ||||
| By state/city |
| ||||
| Diaspora | |||||
| Lists |
| ||||
| |||||
- Lists of United States populated places by ethnic group
- African-American demographics
- Lists of states of the United States
- African American-related lists