List of U.S. states and territories by poverty rate

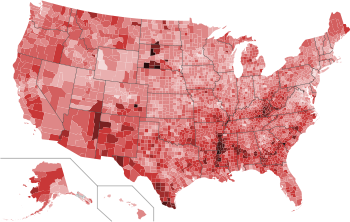
| <5% <10% <15% | <20% <25% <30% | <35% <40% >40% |
This article is a list of U.S. states, federal district, and territories, ordered by poverty rate. 2014 statistics are not identical to official poverty rates because they include children not counted in the official numbers (see Revised Tables link below). Supplemental Poverty Measure takes into account differences in cost of living between states (i.e. housing costs appreciably higher/lower than the national average) as well as taxes and the value of government assistance programs. All data are from the United States Census Bureau.
In 2017–2018, the lowest poverty rate was in New Hampshire, and the highest poverty rate was in American Samoa (the highest poverty rate among the states was in Mississippi).
Data for three U.S. territories (Guam, the Northern Mariana Islands, and the U.S. Virgin Islands) is from American FactFinder (the U.S. Census Bureau); data for Puerto Rico is from the U.S. Census Bureau's "QuickFacts".[1][2][3][4][5] Data for American Samoa is from a 2017 report.[6]
States, federal district, and territories[]
The states and territories are ranked by 2019 data (2019 American Community Survey 1-year estimates) of the percent of people in poverty in each state and territory.[7][note 1]
| Rank | State | 2019 Poverty rate (percent of persons in poverty)[note 2][7] |
2014 Poverty Rates (includes unrelated children) |
Supplemental Poverty Measure (2017–2019 average) (Geographically Adjusted) |
|---|---|---|---|---|
| - | United States | 10.5%[8] | 11.7%[9][10] | |
| 1 | 7.3% | 9.5% | 8.3% | |
| 2 | 8.9% | 9.8% | 8.0% | |
| 3 | 9.0% | 9.6% | 12.0% | |
| 4 | 9.0% | 12.1% | 6.5% | |
| 5 | 9.2% | 13.7% | 12.5%[11][12] | |
| 6 | 9.3% | 12.4% | 11.3% | |
| 7 | 9.3% | 12.6% | 13.4% | |
| 8 | 9.4% | 10.9% | 11.2% | |
| 9 | 9.8% | 11.9% | 9.0% | |
| 10 | 9.9% | 10.8% | 11.5% | |
| 11 | 9.9% | 10.0% | 9.2%[13][14] | |
| 12 | 10.0% | 10.6% | 11.2%[15][16][17] | |
| 13 | 10.1% | 12.1% | 12.3% | |
| 14 | 10.1% | 9.3% | 9.5% | |
| 15 | 10.2% | 9.7% | 9.4%[18] | |
| 16 | 10.4% | 11.1% | 7.5% | |
| 17 | 10.6% | 11.0% | 9.3% | |
| 18 | 10.8% | 13.2% | 7.3% | |
| 19 | 10.9% | 11.6% | 9.6% | |
| 20 | 11.2% | 13.9% | 8.4% | |
| 21 | 11.2% | 10.9% | 6.7% | |
| 22 | 11.3% | 12.4% | 10.5% | |
| 23 | 11.4% | 13.9% | 7.4% | |
| 24 | 11.4% | 7.11% | 11.0% | |
| 25 | 11.5% | 13.3% | 11.4% | |
| 26 | 11.8% | 15.5% | 17.2% | |
| 27 | 11.9% | 16.4% | 10.3% | |
| 28 | 11.9% | 14.3% | 9.2% | |
| 29 | 12.0% | 11.2% | 10.9% | |
| 30 | 12.5% | 13.1% | 13.4% | |
| 31 | 12.6% | 13.5% | 8.9% | |
| 32 | 12.7% | 14.6% | 15.4%[19] | |
| 33 | 12.9% | 15.6% | 9.2% | |
| 34 | 13.0% | 27.6% | 9.7% | |
| 35 | 13.0% | 15.9% | 14.4%[20] | |
| 36 | 13.1% | 13.5% | 10.1% | |
| 37 | 13.5% | 21.3% | 12.0% | |
| 38 | 13.3% | 18.5% | 13.3% | |
| 39 | 13.5% | 18.0% | 16.7%[21] | |
| 40 | 13.6% | 17.0% | 13.1% | |
| 41 | 13.6% | 17.4% | 13.7% | |
| 42 | 13.8% | 13.8% | 13.1% | |
| 43 | 13.9% | 16.7% | 11.0% | |
| 44 | 15.2% | 13.0% | 10.7% | |
| 45 | 15.5% | 16.8% | 13.1% | |
| 46 | 16.0% | 16.0% | 13.3% | |
| 47 | 16.2% | 19.1% | 12.5% | |
| 48 | 16.3% | 17.1% | 11.2% | |
| 49 | 18.2% | 19.6% | 13.6% | |
| 50 | 19.0% | 14.3% | 16.2%[22] | |
| 51 | 19.6% | 23.2% | 15.2%[23] | |
| 52 | 43.5% | — | — | |
| 53 | 65.0% | — | — |
2010 data[]
Guam, the Northern Mariana Islands, and the U.S. Virgin Islands are data deficient (because they are not included in the American Community Survey), not all recent poverty rate estimates have been made for them. Below are the poverty rates for these territories in 2010.
| Rank | Territory | 2010 Poverty rate |
|---|---|---|
| — | 22.4% | |
| — | 22.9% | |
| — | 52.3% |
Notes[]
- ^ In the table below, data for the 50 states, the District of Columbia, and Cuba is from 2019 (American Community Survey estimates). Data for American Samoa is from a 2017 statement by the governor of American Samoa.[6]
- ^ 2018 data for the 50 states, D.C., and Puerto Rico (2018 American Community Survey estimates); 2017 data for American Samoa.
- ^ In 2009, the poverty rate in American Samoa was 57.8%.[5] In 2017 the governor of American Samoa said that the poverty rate in American Samoa was 65%.[6]
See also[]
- List of US states by Gini coefficient
- List of lowest-income places in the United States
- List of lowest-income counties in the United States
- Thank God for Mississippi
References[]
- ^ http://factfinder.census.gov/faces/tableservices/jsf/pages/productview.xhtml?pid=DEC_10_VISF_PBG76&prodType=table Archived 2020-02-14 at archive.today Census.gov. American Factfinder. U.S. Virgin Islands. Poverty Status in 2009 by Age. Retrieved July 2, 2019.
- ^ https://factfinder.census.gov/faces/tableservices/jsf/pages/productview.xhtml?pid=DEC_10_GUSF_PBG82&prodType=table Archived 2020-02-14 at archive.today Census.gov. American Factfinder. Guam. Poverty Status in 2009 by Age. Retrieved July 2, 2019.
- ^ https://www.census.gov/quickfacts/PR Census.gov. Quick Facts. Puerto Rico. Retrieved July 4, 2020.
- ^ https://factfinder.census.gov/faces/tableservices/jsf/pages/productview.xhtml?pid=DEC_10_MPSF_PBG82&prodType=table Archived 2020-02-14 at archive.today Census.gov. American Factfinder. Northern Mariana Islands. Poverty Status in 2009 by Age. Retrieved July 2, 2019.
- ^ Jump up to: a b https://factfinder.census.gov/faces/tableservices/jsf/pages/productview.xhtml?pid=DEC_10_ASSF_PBG82&prodType=table Archived 2020-02-14 at archive.today Census.gov. American Factfinder. American Samoa. Poverty Status in 2009 by Age. Retrieved July 2, 2019.
- ^ Jump up to: a b c d http://www.pireport.org/articles/2017/03/02/american-samoa-governor-says-small-economies-cannot-afford-any-reduction Pireport.org. American Samoa Governor Says Small Economies 'Cannot Afford Any Reduction In Medicaid. Fili Sagapolutele. 03/02/2017. Retrieved 8 January 2018.
- ^ Jump up to: a b https://www.census.gov/quickfacts/US U.S. Census. QuickFacts. (Replace the "US" in the URL with the state abbreviation, such as AL for Alabama, to see each state's data.) Retrieved July 4, 2020.
- ^ https://www.census.gov/quickfacts/fact/table/US/PST045218 U.S. Census. Quick Facts — United States. Retrieved July 4, 2020.
- ^ in 2011, the U.S.,in the official poverty measure. "The Supplemental Poverty Measure: 2019" Check
|url=value (help). Census.gov. Retrieved 5 March 2020. - ^ "Small Area Income and Poverty Estimates - Interactive Data and Mapping - U.S. Census Bureau". Census.gov. Retrieved 18 October 2017.
- ^ "Population Estimates : July 1, 2016". Census.gov. Retrieved 18 October 2017.
- ^ [1][dead link]
- ^ [2][dead link]
- ^ "The Supplemental Poverty Measure : 2013" (PDF). Census.gov. Retrieved 18 October 2017.
- ^ "Population Estimates : July 1, 2016". Census.gov. Retrieved 18 October 2017.
- ^ "Connecticut 2015 Report". Talkpoverty.org. Retrieved 18 October 2017.
- ^ [3][dead link]
- ^ "Population Estimates : July 1, 2016". Census.gov. Retrieved 18 October 2017.
- ^ "Population Estimates : July 1, 2016". Census.gov. Retrieved 18 October 2017.
- ^ "Population Estimates : July 1, 2016". Census.gov. Retrieved 18 October 2017.
- ^ "Population Estimates : July 1, 2016". Census.gov. Retrieved 18 October 2017.
- ^ "Population Estimates : July 1, 2016". Census.gov. Retrieved 18 October 2017.
- ^ "Population Estimates : July 1, 2016". Census.gov. Retrieved 18 October 2017.
External links[]
 Definitions from Wiktionary
 Media from Wikimedia Commons
 News from Wikinews
 Quotations from Wikiquote
 Texts from Wikisource
 Textbooks from Wikibooks
 Resources from Wikiversity
- Total Number of People Living in Poverty based on Household Income (In Thousands), 2005. State Health Facts. December 14, 2007.
- Poverty Rate based on Household Income, 2005 . State Health Facts. December 14, 2007.
- Geographic Adjustments of Supplemental Poverty Measure Thresholds: Using the American Community Survey Five-Year Data on Housing Costs Accessed November 27, 2012.
- The Research Supplemental Poverty Measure Accessed June 5, 2014.
- [4]
- Lists of states of the United States
- United States demography-related lists
- Poverty in the United States
- Ranked lists of country subdivisions