List of U.S. states and territories by educational attainment
| This article is part of a series on |
| Education in the United States |
|---|
| Summary |
|
| Issues |
|
| Levels of Education |
|
|
|
This list of U.S. states and territories by educational attainment covers the 50 U.S. states, the District of Columbia, and the territory of Puerto Rico and their populations' educational attainment for all people of at least 25 years of age. The four other inhabited U.S. territories (American Samoa, Guam, the Northern Mariana Islands, and the U.S. Virgin Islands) are listed separately.
The data source for the main list is the U.S. Census Bureau's American Community Survey in 2019.[1] The data source for the territories table is from 2010 U.S. Census Bureau data, because those territories are excluded from the American Community Survey.[2] The American Community Survey is a large demographic survey collected throughout the year using mailed questionnaires, telephone interviews, and visits from Census Bureau field representatives to about 3.5 million household addresses annually, regardless of their legal immigration status. The survey does not measure graduation rates from different educational institutions, but instead, it measures the percentage of adult residents with a high school diploma.
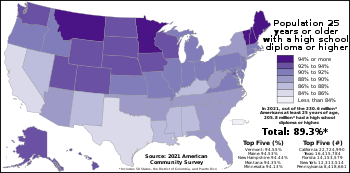
Overall, 88.61% of Americans over the age of 25 had graduated from high school in 2019, with the highest level found in the state of Wyoming at 94.55% and the lowest in the state of California at 84.03%. In Puerto Rico, the proportion was even lower, though, at 78.78%.[1]
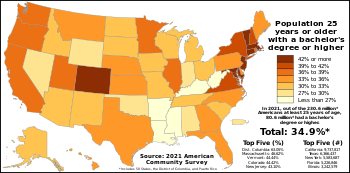
33.13% of Americans over the age of 25 had an educational attainment of having a bachelor's degree or higher in 2019. The state with the highest percentage of people having a bachelor's degree of higher educational attainment was Massachusetts at 44.98%, and the lowest was West Virginia at 21.05%. The District of Columbia had a percentage significantly higher than that of any U.S. state at 59.67%.[1]
Advanced Degrees, such as Master's Degrees and Doctorates were held by 12.79% of Americans at least 25 years old in 2019. Advanced Degrees were most common in Massachusetts, with 20.30% of Massachusetts residents holding an advanced degree of any type in 2019, and they were least common in Arkansas, with 8.26% of Arkansas residents holding an advanced degree. The District of Columbia had a percentage of 34.0%, while in the Commonwealth of Puerto Rico, 7.95% of Americans had an advanced degree, a proportion lower than any state in the U.S.[1]
As of the 2010 Census, four U.S. territories (American Samoa, Guam, the Northern Mariana Islands, and the U.S. Virgin Islands) had educational attainment numbers below every U.S. state (and the District of Columbia). In the U.S. Virgin Islands, 68.9% had attained a high school degree or higher; in American Samoa, 9.9% had attained a bachelor's degree or higher.[2]
List[]
In the list below, one can find the population in each state and territory of the U.S. who has attained a specific education level (out of people 25 years or over), and the percentage of the population who has attained that education level. The list is initially sorted in Alphabetical order but one can click the table headers to sort by any column.[1]
| State or Territory | Population over the age of 25 | With a High School Diploma or higher | With a Bachelor's Degree or higher | With an Advanced Degree | |||
|---|---|---|---|---|---|---|---|
| Population | Pct | Population | Pct | Population | Pct | ||
| 3,360,058 | 2,926,985 | 87.11% | 885,357 | 26.35% | 337,382 | 10.04% | |
| 484,058 | 452,968 | 93.58% | 146,157 | 30.19% | 56,574 | 11.69% | |
| 4,944,540 | 4,331,542 | 87.60% | 1,492,158 | 30.18% | 561,120 | 11.35% | |
| 2,036,456 | 1,781,463 | 87.48% | 475,367 | 23.34% | 168,182 | 8.26% | |
| 26,937,872 | 22,636,359 | 84.03% | 9,428,484 | 35.00% | 3,538,760 | 13.14% | |
| 3,974,943 | 3,672,723 | 92.40% | 1,695,602 | 42.66% | 637,777 | 16.04% | |
| 2,496,420 | 2,264,581 | 90.71% | 994,548 | 39.84% | 445,382 | 17.84% | |
| 687,311 | 620,789 | 90.32% | 228,199 | 33.20% | 93,912 | 13.66% | |
| 505,145 | 463,977 | 91.85% | 301,429 | 59.67% | 171,604 | 33.97% | |
| 15,484,502 | 13,689,867 | 88.41% | 4,753,637 | 30.70% | 1,770,994 | 11.44% | |
| 7,080,222 | 6,224,197 | 87.91% | 2,301,568 | 32.51% | 891,173 | 12.59% | |
| 996,668 | 920,690 | 92.38% | 335,209 | 33.63% | 115,230 | 11.56% | |
| 1,170,997 | 1,071,091 | 91.47% | 336,655 | 28.75% | 116,466 | 9.95% | |
| 8,694,694 | 7,812,057 | 89.85% | 3,108,972 | 35.76% | 1,222,732 | 14.06% | |
| 4,502,015 | 4,033,932 | 89.60% | 1,212,826 | 26.94% | 435,055 | 9.66% | |
| 2,123,004 | 1,966,523 | 92.63% | 622,253 | 29.31% | 202,054 | 9.52% | |
| 1,918,081 | 1,760,324 | 91.78% | 652,489 | 34.02% | 237,638 | 12.39% | |
| 3,048,442 | 2,657,789 | 87.19% | 765,923 | 25.13% | 312,883 | 10.26% | |
| 3,140,201 | 2,699,357 | 85.96% | 784,275 | 24.98% | 280,328 | 8.93% | |
| 991,152 | 923,838 | 93.21% | 328,999 | 33.19% | 123,277 | 12.44% | |
| 4,183,858 | 3,781,706 | 90.39% | 1,710,230 | 40.88% | 798,449 | 19.08% | |
| 4,850,576 | 4,429,635 | 91.32% | 2,181,743 | 44.98% | 984,535 | 20.30% | |
| 6,894,627 | 6,298,340 | 91.35% | 2,070,795 | 30.03% | 818,110 | 11.87% | |
| 3,847,212 | 3,601,522 | 93.61% | 1,433,226 | 37.25% | 490,396 | 12.75% | |
| 1,979,664 | 1,688,747 | 85.30% | 441,751 | 22.31% | 171,039 | 8.64% | |
| 4,206,162 | 3,814,347 | 90.68% | 1,271,281 | 30.22% | 495,473 | 11.78% | |
| 741,950 | 699,268 | 94.25% | 249,148 | 33.58% | 77,839 | 10.49% | |
| 1,271,770 | 1,170,498 | 92.04% | 422,587 | 33.23% | 145,428 | 11.44% | |
| 2,136,466 | 1,855,551 | 86.85% | 548,919 | 25.69% | 193,082 | 9.04% | |
| 979,750 | 914,078 | 93.30% | 368,237 | 37.58% | 143,601 | 14.66% | |
| 6,191,229 | 5,591,610 | 90.32% | 2,551,765 | 41.22% | 995,984 | 16.09% | |
| 1,425,988 | 1,224,660 | 85.88% | 394,598 | 27.67% | 173,317 | 12.15% | |
| 13,664,734 | 11,970,504 | 87.60% | 5,166,218 | 37.81% | 2,267,778 | 16.60% | |
| 7,187,077 | 6,368,153 | 88.61% | 2,321,185 | 32.30% | 849,765 | 11.82% | |
| 504,375 | 471,356 | 93.45% | 153,397 | 30.41% | 44,870 | 8.90% | |
| 8,049,805 | 7,308,958 | 90.80% | 2,356,585 | 29.28% | 891,640 | 11.08% | |
| 2,619,244 | 2,315,978 | 88.42% | 686,509 | 26.21% | 238,621 | 9.11% | |
| 2,988,118 | 2,729,719 | 91.35% | 1,032,316 | 34.55% | 404,405 | 13.53% | |
| 9,028,036 | 8,216,204 | 91.01% | 2,917,402 | 32.31% | 1,155,775 | 12.80% | |
| 2,301,735 | 1,813,327 | 78.78% | 626,580 | 27.22% | 182,991 | 7.95% | |
| 746,952 | 666,745 | 89.26% | 260,275 | 34.84% | 104,188 | 13.95% | |
| 3,563,204 | 3,147,526 | 88.33% | 1,054,559 | 29.60% | 398,063 | 11.17% | |
| 588,029 | 541,735 | 92.13% | 174,784 | 29.72% | 53,553 | 9.11% | |
| 4,693,962 | 4,131,145 | 88.01% | 1,348,224 | 28.72% | 503,124 | 10.72% | |
| 18,772,550 | 15,890,162 | 84.65% | 5,776,533 | 30.77% | 2,025,736 | 10.79% | |
| 1,911,592 | 1,778,532 | 93.04% | 664,661 | 34.77% | 216,552 | 11.33% | |
| 445,558 | 414,700 | 93.07% | 172,272 | 38.66% | 71,257 | 15.99% | |
| 5,872,757 | 5,288,045 | 90.04% | 2,325,070 | 39.59% | 1,012,270 | 17.24% | |
| 5,290,324 | 4,850,250 | 91.68% | 1,955,632 | 36.97% | 750,904 | 14.19% | |
| 1,281,086 | 1,116,281 | 87.14% | 269,706 | 21.05% | 108,020 | 8.43% | |
| 4,015,285 | 3,724,423 | 92.76% | 1,258,379 | 31.34% | 428,501 | 10.67% | |
| 389,847 | 368,597 | 94.55% | 113,557 | 29.13% | 40,374 | 10.36% | |
| 224,898,568 | 199,280,027 | 88.61% | 74,501,651 | 33.13% | 28,771,172 | 12.79% | |
U.S. territories[]
Below is a table of the educational attainment of four U.S. territories (American Samoa, Guam, the Northern Mariana Islands, and the U.S. Virgin Islands.[2] The data in the table below is from the 2010 Census because these territories are not included in the American Community Survey. Puerto Rico is not included in this table because Puerto Rico is included in the American Community Survey (with the name "Puerto Rico Community Survey")[3] — Puerto Rico is included in the table above.
The data below is for people 25 years and older.
| Territory | % High school graduate or higher (2010 Census) |
% Bachelor's degree or higher (2010 Census) |
% Advanced degree (2010 Census) |
Total population (2010 Census) |
Population with high school degree or higher (2010 Census) |
Population with bachelor's degree or higher (2010 Census) |
Population with advanced degree (2010 Census) |
|---|---|---|---|---|---|---|---|
| 82.1% | 9.9% | 3.5% | 25,907 | 21,265 | 4,940 | 906 | |
| 79.4% | 20.4% | 5.2% | 89,253 | 70,905 | 18,179 | 4,666 | |
| 82.4% | 20.2% | 3.7% | 32,602 | 26,865 | 6,585 | 1,202 | |
| 68.9% | 19.2% | 7.4% | 70,813 | 48,791 | 5,450 | 5,229 |
Maps[]

See Also[]
- Education in the United States
- High School in the United States
- Colleges in the United States
- Universities in the United States
- High School Diploma
- Bachelor's Degree
- Master's Degree
References[]
- ^ Jump up to: a b c d e "EDUCATIONAL ATTAINMENT". U.S. Census Bureau. Archived from the original on 20 March 2021. Retrieved 20 March 2021.
- ^ Jump up to: a b c https://data.census.gov/cedsci/table?q=&t=Educational%20Attainment&g=0400000US60&tid=DECENNIALAS2010.PBG26
https://data.census.gov/cedsci/table?q=&t=Educational%20Attainment&g=0400000US66&tid=DECENNIALGU2010.PBG26
https://data.census.gov/cedsci/table?q=&t=Educational%20Attainment&g=0400000US69&tid=DECENNIALMP2010.PBG26
https://data.census.gov/cedsci/table?q=&t=Educational%20Attainment&g=0400000US78&tid=DECENNIALVI2010.PBG24
Data.census.gov. American Samoa / Guam / Northern Mariana Islands / U.S. Virgin Islands educational attainment data (2010 Census). Retrieved September 13, 2021. - ^ https://www.census.gov/programs-surveys/acs/about/puerto-rico-community-survey.html U.S. Census Bureau. About the Puerto Rico Community Survey. Accessed July 5 2021.
 Definitions from Wiktionary
 Media from Wikimedia Commons
 News from Wikinews
 Quotations from Wikiquote
 Texts from Wikisource
 Textbooks from Wikibooks
 Resources from Wikiversity
- United States education-related lists
- States of the United States education-related lists
- Lists of states of the United States