Majority minority
This article possibly contains original research. (October 2014) |
A majority-minority or minority-majority area is a term used to refer to a subdivision in which one or more racial, ethnic, and/or religious minorities (relative to the whole country's population) make up a majority of the local population.
Terminology[]
The exact terminology used differs from place to place and language to language. In many large, contiguous countries like China, there are many autonomous regions where a minority population is the majority. These regions are generally the result of historical population distributions, not because of recent immigration or recent differences in birth and fertility rates between various groups.
Background[]
Majority minority areas exist in two main forms. One form is when a homogeneous grouping residing within an area make up a majority of the local population. This grouping would otherwise be a minority in the broader jurisdiction. The other type occurs when several disparate groupings, when counted together, form a percentage-share majority of the local population, outnumbering the historically dominant group as a composite of diverse minority groups.[1]
Whether distinctions between groups are religious, ethnic, linguistic or racial; these different forms of majority-minority scenarios, or areas, tend to contribute towards different socio-political and cultural environments. For example, a study of the 2006 European Social Survey found that people of localized majority-minority status across 21 EU countries were more supportive of stronger political European integration than existing national native majorities,[2] and a 2019 Pew Research Center study found that 46 percent of white Americans believed national majority-minority demography would negatively impact American culture.[3]
There has also been study on groupings said to have 'old' and 'new' majority-minority status in specific areas. In research funded by the EU's Framework Programmes, a 2015 study explored this difference, finding that, for example, ethnic Austrians living in South Tyrol manifest a culture which tends to oblige ethnic Italians to learn the German language for advancement in the province, such as access to the administration of local government. This was contrasted with 'new' immigration-derived majority-minority populaces in Europe.[4]
Observation by institution[]
Schools[]
In the United States, the vast majority of African Americans and Hispanic and Latino Americans attend schools where white Americans are in the minority.[5] 2006 research from The Civil Rights Project found that, on average, white studuents attend schools that are 78% white, while black and Hispanic students attend schools which are 29% white. A study on this suggested that; "This data is important because "majority minority" schools have the worst facilities (buildings, labs, libraries, athletic facilities), the least qualified teachers, the worst overcrowding, and the least financial support."[6] At a national level in the US with regards racial classification, public schools obtained majority minority status in 2014.[7] At the university level, in 2017, Harvard University's first case of a majority-minority freshman class was reported.[8]
In the Netherlands, majority-minority schools in Amsterdam have emerged in the post-war period. Starting as a phenomenon with immigration from Surinam, and from Curaçao, directly after World War II. In the 1970 and 80s, second-generation students, black Dutch people with ancestry from the Netherlands Antilles, were then joined in classes by the children of workers emigrating from Turkey and Morocco, creating ethnic Dutch minorities in some schools within the country's capital.[9] In a 2020 research of school classes in European cities, Turks in Austria and Belgium were studied, finding that "a 'majority minority' school environment may empower minority group members so that relative numbers would protect them from becoming the target of discrimination."[10]
Observation by settlement[]
Towns and cities[]
Many cities in North America have majority-minority scenarios (based upon racial classifications in the US Census and the Census in Canada).[11] Since the late 20th century, areas of Northern and Western Europe have been undergoing demographic transformation resulting in majority minority cities.[12] A 2018 study in Frontiers in Psychology analyzed:[13]
In the United States and Canada racial minorities already comprise a larger share of the population than Whites in dozens of major cities (e.g., Vancouver and New York). These cities have been dubbed majority-minority areas—or places where the racial/ethnic majority comprise less than half the population (Frey, 2011; Jedwab, 2016). Western Europe is also becoming more diverse, albeit more slowly (Browne, 2000). London, England is one of the few major European cities that has been designated a majority–minority area.
Based upon the UK's Office for National Statistics racial or ethnic categorization, demographic research suggests that Leicester and Birmingham will reach join London in majority minority status in the 2020s.[14][15] University of Antwerp's professor Dirk Geldof, writing in 2016, noted that "within a matter of years, Antwerp will also become a majority-minority city, as will many other European cities."[16] An education inclusion project at Hague University published that; "In superdiverse cities like Paris, The Hague and Brussels there is no majority anymore. These are so-called majority minority cities".[17] According to a study at the European Commission's research repository CORDIS:[18]
In cities like Amsterdam, now only one in three youngsters under age fifteen is of native descent. This situation, referred to as a majority-minority context, is a new phenomenon in Western Europe and it presents itself as one of the most important societal and psychological transformations of our time.
In the course of two generations places Northwestern Europe, such as Amsterdam and Brussels, have become majority minority, with ethnic Dutch, Flemings and Walloons, respectively, representing less than 50 percent of the population of the capitals.[9]
States and regions[]
In 2010, the BBC reported that "America's two largest states - California and Texas - became "majority-minority" states (with an overall minority population outnumbering the white majority) in 1998 and 2004 respectively."[19] Demographers Dudley L. Poston Jr. and Rogelio Sáenz have noted how "nonwhites account for more than half of the populations of Hawaii, the District of Columbia, California, New Mexico, Texas and Nevada. In the next 10 to 15 years, these half-dozen “majority-minority” states will likely be joined by as many as eight other states where whites now make up less than 60 percent of the population."[20]
In Europe, various national medias report on the social situation in the French suburbs with regards to disproportionate poverty and unrest. Known as banlieues, these outer-city regions across France are often majority-minority areas, in terms of race or ethnicity in relation to the ethnic French.[21]
Nations and countries[]
A multitude of scholars have designated countries, or sovereign states, particularly in the developed or Western world, which are projected to obtain majority-minority demography between 2040 to 2050. This includes the United States, Canada and New Zealand, with Australia, and nations in Western Europe, estimated to follow this trend toward the end of the century.[11][20] David Coleman has studied a similar statistical projection in Britain. Coleman, a professor of demography at the University of Oxford, estimates that by 2060 the country will reach majority-minority status, with regards to white people in the United Kingdom.[14][15]
In the developing world, the South American nation of Brazil has been described as a majority-minority country. This is with regards to white Brazilians being the historically largest group, and while remaining culturally dominant, have since become a national minority.[22]
Distinctions between groups[]
There are multiple axis points of difference, and distinction, between groupings of people that can contribute towards the attribution of majority-minority status upon a particular area or within a societal scenario. With cultural, linguistic or religious differences, there is usually a corresponding difference in ethnicity, whether related in a central or peripheral way, to said distinctions. For instance, there are examples of this throughout Europe. Where racial distinctions are made, this is most often in relation to white people, and most usually in European nations or nations derived from European colonialism, such as Australia, Brazil or the United States.
Cultural and linguistic[]
Where religion does not significantly influence designations of majority minority labels, certain cultural and linguistic differences may be emphasized in that particular society, such as in South Tyrol. Whereas the majority of residents in the northern Italian province are ethnic Austrians and speak the German language (in comparison with the Italian-speaking ethnic Italian majority of the broader nation), the population's adherence to Roman Catholicism is similar to the rest of the country.[23]
Ethnic[]
Kosovo has a history of being a majority-minority area via the historic borders of Serbia in the 20th century, and prior to its independence declaration. While this phenomenon may predominantly be observed to be ethnicity-based (upon distinctions between ethnic Albanians and ethnic Serbs), contributing factors involve the Islamic religiosity of Albanians and Christianity of Serbians, as well as the ethno-linguistic considerations of the Albanian language and Serbian language.[24]
Racial[]
When majority minority status is designated or predicted in terms of racial groups, many scholarly and journalistic works make this distinction with reference to white people.[25] Based upon nation-based racial classifications, academics Eric Kaufmann and Matthew Goodwin have suggested that white people will be minorities in the United States, Canada and New Zealand, in what they define as "the ‘majority-minority’ point", by approximately 2050.[26]
Religious[]
While majority-minority status for Catholics in areas of Northern Ireland, in contrast with historical Protestant majorities across the territory as a whole, can be described to be based on religion; there are ethno-linguistic factors (such as Irish-speaking Catholics and English-speaking Protestants), as well as broader overlapping factors of ethnicity (Catholic Gaels and Protestant people of mainly English, Scottish and Huguenot descent) which can contribute toward religiously-defined majority minority attribution.[27]
Regions[]
Africa[]
South Africa[]
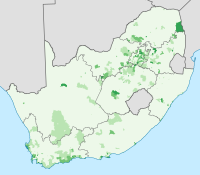
- Whites and Coloureds are a majority in some parts of South Africa while being a minority in South Africa overall.
Asia[]
Azerbaijan[]
- Azeris are a minority in several parts/areas of Azerbaijan.[28]
East Timor[]
- The vast majority (around 96%) of East Timor's population practice Catholicism, owing to Portuguese influence,[29] but on the island of Atauro, Protestants make up the majority due to Dutch influence.
Georgia[]
- The Georgian province of Samtskhe-Javakheti has an Armenian majority, while the Georgian province of Kvemo Kartli has an Azeri plurality.[30] No ethnic group composed a majority of the population in Abkhazia from at least 2003 until around 2011.[31][32]
India[]

- Muslims are a majority in the Lakshadweep and Jammu and Kashmir states/territories of India, and in some other districts of India. However, Muslims are a minority in India overall.
- Christians currently make up the majority of the Northeast Indian states of Nagaland at 90%, Mizoram at 88% and Meghalaya at 83.3%, although Christians do not even make up more than 3% of India's total population.[33]
- Sikhs make the majority of state of Punjab, although once again they do not form a majority in India overall.[34]
- In the Northeast Indian state of Arunachal Pradesh, no religious or ethnic group constitutes more than 30% of its population,[34] owing to the state's great cultural diversity.
Indonesia[]
- Indonesia is the world's most populous Muslim country, with Islam being practiced by around 88% of the population, or over 200 million people.[35] Despite this there are several areas of Indonesia where Muslims are the minority:
- 84% of the population of Bali practice a form of Hinduism called Balinese Hinduism,[36] although Hindus only form 1.7% of Indonesia's overall population.[35]
- Catholics form the majority of East Nusa Tenggara at 51%,[36] although Catholics only form about 3% of Indonesia's overall population.[35]
- Protestants form the majority in three Indonesian provinces: West Papua at 60%, Papua at 68%, and North Sulawesi at 64%.[36] Overall though Protestants only form about 7% of Indonesia's population.[35]
- Several neighborhoods and communities in major Indonesian cities such as Jakarta, Bandung, Semarang, Medan and Yogyakarta are of predominantly of Chinese origin, although people of Chinese descent do not form more than 10% in any of these cities overall population and only form about 1-2% of Indonesia's overall population.[37]
Israel[]

- Arabs are a majority of the population in Israel's Northern District and in several other smaller parts of Israel.[38]
- Non-Haredi Jews are projected to become a minority of Israel's total population by 2059.[39][40]
Kazakhstan[]
- The Kazakh SSR did not have any ethnic group/nationality comprise a majority between 1933 and 1997.[41][42] Based on the 2009 census and annual estimates thereafter, some regions of Kazakhstan still did not have a Kazakh majority as of 2018.[43][44]
Kyrgyzstan[]
- The Kirgiz SSR did not have any ethnic group/nationality comprise a majority between 1941 and 1985.[41]
Mongolia[]
- Kazakh-speaking Muslims make up around 93%[45] of Mongolia's Bayan-Ölgii Province, although they make up only about 3–5% of the overall population.[46]
Sri Lanka[]
- The Sinhalese are a minority in Northern Province, Eastern Province and most parts of the Colombo.[47]
Thailand[]

- Malay-speaking Muslims make up the majority in several of Thailand's southern provinces (Narathiwat, Pattani, Yala, Songkhla, and Satun).[48]
Europe[]
Belarus[]
- Belarusians are a minority in some parts of Belarus.[49]
Bosnia and Herzegovina[]
- Bosnia and Herzegovina did not have any ethnic group comprise a majority of its population at the time of the last census in 1991 (which took place before the Bosnian War).[50] A census was conducted in Bosnia and Herzegovina in October 2013, and these results showed a slight Bosniak majority, who constitute 50.11% of the population.[51]
Bulgaria[]
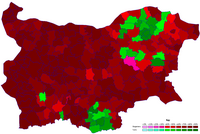
- Ethnic Turks outnumber ethnic Bulgarians in Kardzhali and Razgrad Provinces (ethnic Bulgarians are an about 85% majority in Bulgaria overall).[52]
- According to the Bulgarian census of 2001, a total of 43 municipalities (out of 262) have a Muslim majority, although Muslims only form around 10% of Bulgaria's total population.[53]
Estonia[]

- While Estonians form a majority of the population in Estonia overall, Russians made up a majority in Ida-Viru County, parts of Tallinn and some towns and villages in other counties.[54][55]
Italy[]
- German speakers are the local majority and an officially recognised national minority in the autonomous province of South Tyrol; standard German is taught in schools and used in all writing, but the South Tyrolean dialect is commonly spoken; German speakers are the majority in 103 out of 116 municipalities, and in the province as a whole.
- Ladin is a recognised minority language spoken in the Dolomites mountains, being the majority language in 15 municipalities of the Trentino-Alto Adige region.
- The Slovene minority in Italy is the majority in some municipalities in eastern parts of the Friuli-Venezia Giulia region.
- French and Franco-Provençal (Valdôtain) are officially recognised and spoken by 58% of the population of Aosta Valley region, although there is no official figure of the municipalities where speakers are majority.
Kosovo[]
- North Kosovo has a Serb majority, while Kosovo overall has an Albanian majority.[56] This division has led to controversial negotiations for land swapping southern Albanian-majority areas of Serbia for northern Serb-majority areas of Kosovo.[57][58]
Latvia[]

- The Latvian SSR almost became minority-majority (the ethnic Latvian population there decreased from 62% to 52% between 1959 and 1989), but the collapse of the USSR prevented this from happening.[41][59][60][61] While the whole Latvian SSR never became majority-minority, its eight largest cities did become majority-minority by 1989.[62]
Moldova[]
- Transnistria did not have any ethnic group compromise a majority of its population in 2004.[63]
Montenegro[]
- Montenegro does not have any ethnic group compromise a majority of its population.[64]
North Macedonia[]
- North Macedonia has some places/areas where Macedonians are a minority.[65] These places/areas often have an Albanian majority.[65]
Romania[]

- The Harghita and Covasna provinces in Romania have a Hungarian majority, while Romania as a whole has a Romanian majority.[66]
Russia[]

- There were concerns that the whole Soviet Union would lose its ethnic Russian majority due to the high birth rates in the Caucasus and Central Asia as early as 1970.[67] The percentage of Russians among the whole Soviet population was consistently declining, from 55% in 1959 to 51% in 1989.[41] However, the Soviet Union collapsed in 1991, before the Soviet Union could have lost its ethnic Russian majority. In the Russian Federation era, based on the 2010 census; 8 of the 22 republics of Russia had a non-Russian majority, while 9 of the 22 had a Russian majority.[68]
Serbia[]
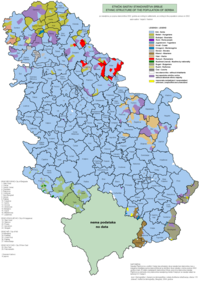
- Serbia has some municipalities where Serbs are a minority, notably in north of Vojvodina where Hungarians are a majority.[69][70]
- Bosniak Muslims form the majority of the city of Novi Pazar and the surrounding region, although they only form around 3% of Serbia's total population.[71]
- Albanians form the majority of population in the municipalities of Preševo and Bujanovac.[72]
Slovakia[]
- Slovakia has some places/areas where Slovaks are a minority and Hungarians are a majority.[73]
Ukraine[]
- Ukrainians are a minority in the Crimea, Sevastopol, and some places in other regions, especially Donbass and Budjak.[74] However, Ukraine ended up losing control over Crimea and the Donbass in 2014.
United Kingdom[]
- White British (mainly English people) are an ethnic minority in London (43.7%), but those identifying as "White" are 59.8% of London's population.[75]
- White British people are also a minority in Luton, Slough and Leicester.
- Predominantly-Muslim South Asians make up just under 30% of the population of the city of Blackburn but over 50% of those under 18.[76]
North America[]
Canada[]
- Unlike in the United States, which has six minority-majority states, no Canadian province is minority-majority. The definition of an ethnic minority differs between US and Canada. In the US this term includes anyone who is either not White (Middle Eastern Americans are considered White) or who is Hispanic (Hispanic Whites are considered as minority). However, in Canada it is defined (by the Employment Equity Act, used by Statistics Canada) as "persons, other than Aboriginal peoples, who are non-Caucasian in race or non-white in colour." Thus, (a) Aboriginals are considered majority, (b) Hispanic whites are considered majority, but (c) non-white Arabs and West Asians are considered a minority, even if Caucasian in race. However, the numbers are not close so that difference does not bear any practical significance except for the territory of Nunavut and Northwest Territories, which would be minority-majority if the US definition of racial minority were to be applied (24,875 of 29,325 residents in Nunavut are Inuit).
- The province with the highest proportion of visible minorities (2016 Census) is British Columbia (30.3%), followed by Ontario (29.3%). That means in no Canadian province has a percentage of the racial majority (Aboriginals + White Caucasians) that has fallen under 65%.
- Toronto (CMA) is a minority-majority metropolitan area. Also, Vancouver (CMA) is on the tip of becoming such. In particular, according to the 2016 Census, the Toronto CMA has 51.4% of visible minorities, and the Vancouver CMA has 48.9% of visible minorities. They are the only metropolitan areas in Canada where the percentage of the racial majority has fallen under 60%. Taking into account the 20 largest census metropolitan areas, Calgary comes a distant third with 33.7%.
- Racial or "visible minorities" (as they are known in Canada) are the majority in the cities of Vancouver, and Toronto.
- The Toronto district of Scarborough has a population made up of 67.4% visible minorities. All but one of the ten Scarborough wards are visible-minority-majority of which, in particular, Scarborough-Agincourt and Scarborough-Rouge River are Chinese-majority (53.4% and 57.3% respectively; 83.7% and 87.8% respectively for all visible minorities). Likewise, 19 of 25 Scarborough neighbourhoods (as designated by the City of Toronto) are visible-minority-majority. For purposes of contradistinction, in the "Old" (pre-amalgamation) City of Toronto, 68% of the population are white Caucasian (or Aboriginal) and the visible-minority-majority neighbourhoods are five in a total of 44 neighbourhoods (Regent Park, North St. James Town, Bay Street Corridor, Kensington-Chinatown, and Parkdale).
- The Toronto suburbs of Markham (77.93%) and Brampton (73.31%) also have a minority-majority population, of primarily Chinese and East Indian ethnic origin respectively.
- The Vancouver suburbs of Richmond (76.3%) and Burnaby (63.6%) also have a minority-majority population, of primarily Chinese ethnic origin in both cases.
- The French linguistic minority is the majority in the province of Quebec (77.1% have French as their mother tongue, according to the 2016 Census) and has been the predominant language of the province since before Canadian Confederation.
- Regarding religion (2001 Census data), Quebec and New Brunswick have a Roman Catholic majority, and Newfoundland and Labrador and Nunavut have a Protestant majority. In the other provinces and territories, no denomination exceeds the 50% mark; however, Protestants are the largest denomination first in all provinces and territories except only Prince Edward Island and Northwest Territories where Catholics are the largest denomination. No other Christian denomination, other religion or lack of religious affiliation as first or second in any province or territory.
Visible minority majorities in different Canadian municipalities:
British Columbia
- Richmond (76.3%) 2016
- Burnaby (63.6) 2016
- Surrey (52.6) 2016
- Vancouver (51.6) 2016
- Coquitlam (50.2) 2016
Ontario
- Markham (77.93) 2016
- Brampton (73.31) 2016
- Richmond Hill (59.96) 2016
- Mississauga (57.15) 2016
- Ajax (56.67) 2016
- Toronto (51.5%) 2016
United States[]

In the United States of America, majority-minority area or minority-majority area is a term describing a U.S. state or jurisdiction whose population is composed of less than 50% non-Hispanic whites. White Hispanic and Latino Americans are excluded in many definitions. Racial data is derived from self-identification questions on the U.S. Census and on U.S. Census Bureau estimates. (See Race and ethnicity in the United States Census). The term is often used in voting rights law to designate voting districts which are altered under the Voting Rights Act to enable ethnic or language minorities "the opportunity to elect their candidate of choice."[77] In that context, the term is first used by the Supreme Court in 1977.[78] The Court had previously used the term in employment discrimination and labor relations cases.[79]
Oceania[]
This section needs additional citations for verification. (August 2013) |
Australia[]
It is estimated that Europeans first outnumbered Indigenous Australians in Australia in the 1840s.[80][81] There are still a number of rural and regional towns and communities where Indigenous Australians outnumber Europeans, but nationally Indigenous Australians constitute only 3.3% of the population.
Of the other ethnic groups in Australia, no single ethnic group constitutes a majority overall. English Australians make up the largest single ethnic group by ancestry, being reported by 36.1% of the population in the 2016 census. The next largest ancestry group is "Australian", at 33.5%.[82] As ancestry is self-reported and each person can nominate two ancestries (and through a separate question report whether they identify as Indigenous Australian), there is no certainty as to the ethnic make-up of the ancestry group who identify as "Australian". It is commonly speculated however that the majority of the "Australian" ancestry group have some ancestral origin from the British Isles, and as a result when people with ethnic origin in the British Isles are considered as a single group ("Anglo-Celtic Australians"), the numbers for the "Australian" ancestry group is added to that of the English, Scottish, Welsh, and Irish ethnic groups, as well as (sometimes) Manx Australians and Cornish Australians. When "Anglo-Celtic" ethnic groups are considered together, they make up a majority of Australia's population overall (58% estimated in 2018[83]). When considered as one group, European Australians make up 76% of the population.
Reflecting the diversity of ancestries at the national level, in most Australian towns and suburbs, no single ancestry group constitutes a majority of the population. In many places, if the "Australians" ancestry group is counted as part of an "Anglo-Celtic" ethnic group together with English, Scottish, Welsh and Irish Australians, this group constitutes a majority of the local population. However, in many other places, even when these ancestry groups are counted as one, there is no single majority ethnic group. There are a very small number of exceptions, where a non-Anglo-Celtic and non-Indigenous ethnic group makes up a majority of the local population.[84] For example, in the Sydney metropolitan area, Chinese people in the suburbs Burwood and Hurstville make up just over 50% of the population, although reports of Chinese ancestry are less than 50% of all ancestries reported in the census in each suburb, as each person is permitted to nominate more than one ancestry.[84] Chinese Australians make up 5.6% of the national population, making them the fifth largest ancestry group overall (after the English, Australian, Scottish and Irish ancestry groups).[82]
Fiji[]
- Fiji did not have any racial or ethnic group comprise a majority from the 1930s to the 1990s, with the exception of the 1960s and possibly early-1970s.[85]
New Zealand[]
- European New Zealanders are a minority in nine of Auckland's 21 local board areas (Henderson-Massey, Whau, Puketapapa, Maungakiekie–Tamaki, Howick, Mangere–Otahuhu, Otara–Papatoetoe, Manurewa, and Papakura) and the Wairoa District.[86]
- The indigenous Māori people form a majority in the Kawerau, Opotiki, Gisborne and Wairoa Districts, and the Chatham Islands Territory.[86]
- Pacific peoples form a majority in the Mangere–Otahuhu local board area of Auckland.[86]
South America[]
Brazil[]
Brazil has become a majority "non-White" country as of the 2010 census,[87] together with the federative units of Espírito Santo, the Federal District, Goiás, and Minas Gerais.
Those identifying as White declined to 47.7% (about 91 million people) in the 2010 census from 52.9% (about 93 million people) in 2000 in the entire country.[87] However, in Brazil, this is not simply a matter of origin and birthrate, but identity changes as well. The Black minority did not enlarge its representation in the population to more than 1.5% in the period, while it was mostly the growth in the number of pardo people (~38% in 2000, 42.4% in 2010) that caused the demographic plurality of Brazil.
Colombia[]
Afro-Colombians make up roughly about 10–12% of country's overall population, but make up a majority in many areas in the Colombia's Pacific region,[88] especially in Chocó Department, where they make up 80–90% of the population.[89]
See also[]
- List of majority minority United States congressional districts
- Lists of U.S. cities with non-white majority populations
- List of U.S. communities with Hispanic-majority populations in the 2010 census
- Race and ethnicity in censuses
- Race and ethnicity in the United States
- Race and ethnicity in the United States Census
- Dominant minority
References[]
- ^ Paul Taylor; D’Vera Cohn (November 7, 2012). "A Milestone En Route to a Majority Minority Nation". Pew Research Center.
The minority groups that carried President Obama to victory yesterday by giving him 80% of their votes are on track to become a majority of the nation’s population by 2050, according to projections by the Pew Research Center.
- ^ Kathleen M. Dowley; Brian D. Silver (July 2011). "Support for Europe among Europe's Ethnic, Religious, and Immigrant Minorities". International Journal of Public Opinion Research. 23. Oxford University Press.
By this test, then, for all five indicators of majority–minority status, that minority group members in the 21 EU countries are more supportive of stronger European unification than majority group members is far from just a random finding.
- ^ Ryan W. Miller (March 21, 2019). "46% of whites worry becoming a majority-minority nation will 'weaken American culture,' survey says". USA Today.
Almost half of white Americans say the USA becoming a majority nonwhite nation would "weaken American customs and values," a new Pew Research Center survey says.
- ^ Roberta Medda-Windischer (2015). "Integration of New and Old Minorities in Europe" (PDF). European Academy of Bolzano: Framework Programmes for Research and Technological Development.
Figure 1: Majority-Minority Relationship: An Asymmetrical Balance. ... members of the majority in areas inhabited by old minorities can sometimes be obliged to learn the minority language (for instance, in South Tyrol where the members of the Italian-speaking group living in South Tyrol are under the obligation to learn the minority language, German, at school and must provide evidence of the knowledge of the minority language if they want to obtain a post in the Public Administration of the Province of South Tyrol), whereas the same obligation cannot be found, at least as far as Europe is concerned, in areas inhabited even largely by new minorities.
- ^ Vinecia Perkins, "The Illusion of French Inclusion: The Constitutional Stratification of French Ethnic Minorities", Georgetown Journal of Law & Modern Critical Race Perspectives, 11, Georgetown University Law Center, p. 183,
In the educational context, eighty percent of Latinos and seventy-four percent of African Americans attend majority-minority schools that receive far less funding than their majority-white schools.
- ^ David B. Oppenheimer (2008), "Why France Needs to Collect Data on Racial Identity... In a French Way", Hastings International and Comparative Law Review, 31, UC Hastings College of the Law, p. 739
- ^ Claudia Rowe (December 22, 2016). "Students of color changing the face of Washington schools — and the state, too". The News Tribune.
At the national level, public schools became majority-minority in 2014.
- ^ Amy X. Wang (August 4, 2017). "White students in Harvard's new class will find themselves a minority for the first time in history". Quartz.
Its incoming freshman class is, for the first time, majority non-white: 50.9% of the students come from minority groups, which include Native Americans, Hispanics and Latinos, Asian-Americans, African-Americans, and Pacific Islanders, according to new data released by the university. Harvard's new freshman class is majority minority.
- ^ Jump up to: a b Maurice Crul (June 2015). "Super-diversity vs. assimilation: how complex diversity in majority–minority cities challenges the assumptions of assimilation". Journal of Ethnic and Migration Studies. Taylor and Francis.
International migration changed large West European cities dramatically. In only two generations’ time, their ethnic make-up is turned upside down. Cities like Amsterdam and Brussels now are majority–minority cities: the old majority group became a minority. This new reality asks for an up-to-date perspective on assimilation and integration.
- ^ Gülseli Baysu; Karen Phalet; Rupert Brown (2020), "Relative group size and minority school success: The role of intergroup friendship and discrimination experiences", British Journal of Social Psychology, Wiley-Blackwell
- ^ Jump up to: a b Eric Kaufmann (April 6, 2019). "White fright: the future of the West's white majorities". The Australian.
Whites are already a minority in most major cities of North America. Together with New Zealand, North America is projected to be “majority minority” by 2050, with Western Europe and Australia following suit later in the century.
- ^ Justin Gest (July 2020). "Majority Minority: a comparative historical analysis of political responses to demographic transformation". Journal of Ethnic and Migration Studies. Taylor and Francis.
This question has grown in salience as the politics of the United States and Western Europe react to the prospect of becoming Majority Minority states — where the native constituency of people, defined by race, ethnicity, and/or religion, loses its numerical advantage in the territory of a sovereign state.
- ^ H. Robert Outten; Timothy Lee; Rui Costa-Lopes; Michael T. Schmitt; Jorge Vala (February 2018). "Majority Group Members' Negative Reactions to Future Demographic Shifts Depend on the Perceived Legitimacy of Their Status: Findings from the United States and Portugal". Frontiers in Psychology. Frontiers Media.
- ^ Jump up to: a b David Coleman (November 17, 2010). "When Britain becomes "majority minority"". Prospect.
Outside London, Leicester and the City of Birmingham are both expected to become “majority minority” some time in the 2020s.
- ^ Jump up to: a b David Coleman (2010), "Projections of the Ethnic Minority Populations of the United Kingdom 2006–2056", Population and Development Review, 36, Wiley Online Library, p. 441-486
- ^ Dirk Geldof (2016). Superdiversity in the heart of Europe: how migration changes our society. Acco. ISBN 978-9462924284.
- ^ "Centre of Expertise Global and Inclusive Learning: Multinclude". Hague University.
- ^ Becoming A Minority, VU University Medical Center: European Research Council,
But are we also looking into the actual integration of the receiving group of native ‘white’ descent in city contexts where they have become a numerical minority themselves? ... This situation, referred to as a majority-minority context, is a new phenomenon in Western Europe
- ^ Iwan Morgan (December 23, 2010). "Why the US outstrips Europe for population growth". BBC.
- ^ Jump up to: a b Dudley L. Poston Jr.; Rogelio Sáenz (May 25, 2019). "emographic trends spell the end of the white majority in 2044". Associated Press.
Census Bureau projections show that the U.S. population will be “majority-minority” sometime between 2040 and 2050. Our research suggests that this will happen around 2044. Indeed, in 2020, there are projected to be more nonwhite children than white children in the U.S.
- ^ Jamila Mascat (March 7, 2020). "When the "Scum" From the Paris Suburbs Built Picket Lines". Jacobin.
They are more or less young (but still rarely much over forty), what the press call “of immigrant background,” and from the majority-minority banlieue suburbs.
- ^ Hope Yen (March 17, 2013). "Rise of Latino population blurs US racial lines". Associated Press.
Despite being a nation of immigrants, America’s tip to a white minority has never occurred in its 237-year history and will be a first among the world’s major post-industrial societies. Brazil, a developing nation, has crossed the threshold to “majority-minority” status; a few cities in France and England are near, if not past that point.
- ^ Heiko F. Marten; Michael Rießler; Janne Saarikivi; Reetta Toivanen, eds. (2015). "Parliamentary Structures and Their Impact". Cultural and Linguistic Minorities in the Russian Federation and the European Union: Comparative Studies on Equality and Diversity. Springer Publishing. p. 267. ISBN 978-3319104553.
In this way, the minority-majority relationship in the territory of South Tyrol for the areas of decentralized authority is reversed in relation to the dominant majority-minority relations in the Italian state.
- ^ Edona Maloku; Kaltrina Kelmendi; Marko Vladisavljevic (2017). "Who Is This New We? Similarities and Differences of Ethnic, Religious, and National Identity among the Albanian Majority and the Serb Minority in Post-Conflict Kosovo". In Pratto, F; Žeželj, I; Maloku, E; Turjačanin, V; Branković, M (eds.). Shaping Social Identities After Violent Conflict: Youth in the Western Balkans. Palgrave Macmillan. p. 113-133. ISBN 978-3319620213.
- ^ Amy Drew; Scott Sleek; Anna Mikulak (March 31, 2016). "When the Majority Becomes the Minority". Association for Psychological Science.
With rising immigration and declining birth rates, we are indeed witnessing a seismic shift in the ethnic and cultural makeup of many nations in the developed world. Racial and ethnic majorities are slowly transitioning toward minority-group status. In the United States, Canada, and parts of Europe, Whites may still comprise the single largest racial group, but their numbers are on the verge of shrinking below the combined populations of other ethnic groups.
- ^ Eric Kaufmann; Matthew Goodwin (October 25, 2018). "Rising ethnic diversity in the West may fuel a (temporary) populist right backlash". London School of Economics.
The ethnic make-up of many western countries is changing, and in countries previously seen as having ‘white’ majorities that past predominance is declining. In the United States, Canada and New Zealand, the ‘majority-minority’ point will arrive around 2050, while in western Europe it is projected to occur towards the end of the century. Some commentators have asked if this change may lead to a growing reaction or ‘white backlash’. All else being equal, we suggest that the answer may be yes.
- ^ Clifford Stevenson; Susan Condor; Jackie Abell (2007). "The Minority-Majority Conundrum in Northern Ireland: An Orange Order Perspective". Political Psychology. 28. Wiley. p. 105-125.
- ^ "Ethnic composition of Azerbaijan 2009". Pop-stat.mashke.org. April 7, 1971. Retrieved March 22, 2013.
- ^ International Religious Freedom Report 2007: Timor Leste. United States Bureau of Democracy, Human Rights and Labor (14 September 2007). This article incorporates text from this source, which is in the public domain.
- ^ "Ethnic composition of Georgia 2002". Pop-stat.mashke.org. Retrieved March 22, 2013.
- ^ "Ethnic composition of Abkhazia 2003". Pop-stat.mashke.org. Retrieved March 18, 2013.
- ^ "Ethnic composition of Abkhazia 2011". Pop-stat.mashke.org. Retrieved March 18, 2013.
- ^ ORGI. "Census of India Website : Office of the Registrar General & Census Commissioner, India". www.censusindia.gov.in.
- ^ Jump up to: a b "Population by religion community – 2011". The Registrar General & Census Commissioner, India. Archived from the original on September 23, 2015.
- ^ Jump up to: a b c d "Penduduk Menurut Wilayah dan Agama yang Dianut" [Population by Region and Religion] (in Indonesian). Jakarta, Indonesia: Badan Pusat Statistik. May 15, 2010. Retrieved October 20, 2011.
Religion is belief in Almighty God that must be possessed by every human being. Religion can be divided into Muslim, Christian, Catholic, Hindu, Buddhist, Hu Khong Chu, and Other Religion.
Muslim 207176162 (87.18%), Christian 16528513 (6.96), Catholic 6907873 (2.91), Hindu 4012116 (1.69), Buddhist 1703254 (0.72), Confucianism 117091 (0.05), Other 299617 (0.13), Not Stated 139582 (0.06), Not Asked 757118 (0.32), Total 237641326 - ^ Jump up to: a b c "Population by Region and Religion in Indonesia". BPS. 2010.
- ^ Johnston, Tim (March 3, 2005). "Chinese diaspora: Indonesia". BBC News. BBC.
- ^ "Statistical Abstract of Israel 2012 – No. 63 Subject 2 – Table No. 8". .cbs.gov.il. Archived from the original on November 13, 2012. Retrieved March 18, 2013.
- ^ "CBS predicts Arab-haredi majority in 2059 – Israel News, Ynetnews". Ynetnews.com. June 20, 1995. Retrieved March 16, 2013.
- ^ Arlosoroff, Meirav. "The majority in Israel is steadily becoming a minority – Business – Israel News | Haaretz Daily Newspaper". Haaretz.com. Retrieved June 24, 2013.
- ^ Jump up to: a b c d "Приложение Демоскопа Weekly". Demoscope.ru. December 26, 2011. Archived from the original on October 12, 2013. Retrieved December 3, 2012.
- ^ "Ethnodemographic situation in Kazakhstan" (PDF). Archived from the original (PDF) on January 20, 2013.
- ^ "Ethnic composition of Kazakhstan: 2009 census" (in Russian). pop-stat.mashke.org. 2009. Retrieved January 1, 2019.
- ^ "Ethnic composition of Kazakhstan: 2018 estimation (based on 2009 census)". Pop-stat.mashke.org. 2018. Retrieved January 1, 2019.
- ^ Introduction
- ^ 2010 Population and Housing Census of Mongolia. Data recorded in Brian J. Grim et al. Yearbook of International Religious Demography 2014. BRILL, 2014. p. 152
- ^ "Census of Population and Housing – 2012". www.statistics.gov.lk.
- ^ William M. Carpenter; James R. Lilley; David G. Wiencek; Henry Stephen Albinski (1996). Asian Security Handbook: An Assessment of Political-Security Issues in the Asia-Pacific Region. M.E. Sharpe. pp. 240–6. ISBN 1-56324-813-1.
- ^ "Ethnic composition of Belarus 2009". Pop-stat.mashke.org. Retrieved March 22, 2013.
- ^ "Ethnic composition of Bosnia & Herzegovina 1991". Pop-stat.mashke.org. Retrieved June 26, 2013.
- ^ https://web.archive.org/web/20171224103940/http://www.popis2013.ba/popis2013/doc/Popis2013prvoIzdanje.pdf
- ^ "Ethnic composition of Bulgaria 2001". Pop-stat.mashke.org. Retrieved March 18, 2013.
- ^ "Archived copy". Archived from the original on December 25, 2009. Retrieved November 7, 2012.CS1 maint: archived copy as title (link)
- ^ "Ethnic composition of Estonia 2000". Pop-stat.mashke.org. Retrieved March 18, 2013.
- ^ "Ethnic composition of Estonia 2011". Pop-stat.mashke.org. Retrieved March 18, 2013.
- ^ "Ethnic composition of Kosovo 2011". Pop-stat.mashke.org. Retrieved March 18, 2013.
- ^ Bytyci, Fatos (September 6, 2018). "Kosovo, Serbia consider a land swap, an idea that divides the Balkans". Reuters.
- ^ Kupchan, Charles A. (September 13, 2018). "An Offensive Plan for the Balkans That the U.S. Should Get Behind". New York Times.
- ^ "Migration Information Source – Latvia Looks West, But Legacy of Soviets Remains". Migrationinformation.org. Retrieved December 3, 2012.
- ^ "Pittsburgh Post-Gazette – Google News Archive Search". news.google.com.
- ^ "Ethnic composition of Latvia 2000". Pop-stat.mashke.org. Retrieved December 3, 2012.
- ^ Dreifelds, Juris (February 23, 1996). Latvia in Transition – Juris Dreifelds – Google Books. ISBN 9780521555371. Retrieved December 3, 2012.
- ^ "Ethnic composition of Transnistria 2004". Pop-stat.mashke.org. Retrieved June 26, 2013.
- ^ "Statistical Office of Montenegro". Monstat. Retrieved June 26, 2013.
- ^ Jump up to: a b "Ethnic composition of Macedonia 2002 (new division)". Pop-stat.mashke.org. Retrieved March 18, 2013.[failed verification]
- ^ "Ethnic composition of Romania 2002". Pop-stat.mashke.org. Retrieved March 16, 2013.
- ^ "Sarasota Herald-Tribune – Google News Archive Search". news.google.com.
- ^ "Ethnic composition of Russia: 2010 census". Pop-stat.mashke.org. 2010. Retrieved January 1, 2019.
- ^ "Ethnic composition of Serbia 2011". Pop-stat.mashke.org. Retrieved March 16, 2013.
- ^ "Population – Data by Municipalities and Cities" (PDF). 2011 Census of Population, Households, and Dwellings in the Republic of Serbia. 2013.
- ^ Government of Serbia 2014, p. 194.
- ^ "2011 Census of Population, Households and Dwellings in the Republic of Serbia" (PDF). stat.gov.rs. Statistical Office of the Republic of Serbia. Archived from the original (PDF) on July 14, 2014. Retrieved January 15, 2017.
- ^ "Ethnic composition of Slovakia 2011". Pop-stat.mashke.org. Retrieved March 18, 2013.
- ^ "Ethnic composition of Ukraine 2001". Pop-stat.mashke.org. Retrieved March 22, 2013.
- ^ "Ethnicity and National Identity in England and Wales – Office for National Statistics". www.ons.gov.uk.
- ^ Perlez, Jane (April 2, 2007). "Old Church Becomes Mosque in Uneasy Britain". The New York Times. Archived from the original on May 1, 2009. Retrieved April 30, 2010.
- ^ United Jewish Organizations of Williamsburgh, Inc. v. Carey, 430 U.S. 144 97 S.Ct. 996 (Supreme Court of the United States March 01, 1977).
- ^ United Jewish Organizations of Williamsburgh, Inc. v. Carey, 430 U.S. 144 97 S.Ct. 996 (Supreme Court of the United States March 01, 1977)
- ^ Sledge (Harrison) v. J.P. Stevens & Co., Not Reported in F.Supp. 1975 WL 278 (United States District Court; E.D. North Carolina, Wilson Division. December 22, 1975); Winchester Spinning Corp. v. N. L. R. B., 402 F.2d 299 (United States Court of Appeals Fourth Circuit. October 08, 1968).
- ^ Broome (1988), pp. 102–103.
- ^ Gittins, Ross (December 26, 2015). "Maybe the colonialists were actually a minority". Sydney Morning Herald. Retrieved August 19, 2017.
- ^ Jump up to: a b ABS, 2016 census - Cultural Diversity Data Summary
- ^ "Australian Human Rights commission 2018" (PDF). 2018. Retrieved February 4, 2020.
- ^ Jump up to: a b Australian Bureau of Statistics (October 31, 2012). "Rooty Hill (State Suburb)". 2011 Census QuickStats. Retrieved April 25, 2015.

- ^ "Pacific Regional Statistics – Secretariat of the Pacific Community". www.spc.int.
- ^ Jump up to: a b c "2013 Census QuickStats about culture and identity – data tables". Statistics New Zealand. April 15, 2014. Archived from the original on May 24, 2014. Retrieved February 12, 2016.
- ^ Jump up to: a b Barnes, Taylor (May 24, 2011). "For the first time, blacks outnumber whites in Brazil" (PDF). The Miami Herald.
- ^ Fundación Hemera (2007). "Ethnic groups: Afro-Colombians". Ethnicities of Colombia (in Spanish). Archived from the original on 22 February 2008. Retrieved 29 December 2007.
- ^ "La visibilización estadística de los grupos étnicos colombianos" (PDF) (in Spanish).
External links[]
- "U.S. Census demographic estimates". Archived from the original on December 6, 2006. Retrieved September 12, 2006.CS1 maint: bot: original URL status unknown (link)
- 10% of U.S. Counties Now 'Majority-Minority'
- Demographics of the United States
- Majority–minority relations