Obesity in the United States
Obesity in the United States is a major health issue resulting in numerous diseases, specifically increased risk of certain types of cancer, coronary artery disease, type 2 diabetes, stroke, as well as significant increases in early mortality and economic costs.
The CDC defines an adult (a person aged 20 years or greater) with a body mass index (BMI) of 30 or greater as obese and an adult with a BMI of 25.0 to 29.9 as overweight.[1] Obesity in adults is divided into three categories. Adults with a BMI of 30 to 34.9 have class 1 obesity; adults with a BMI of 35 to 39.9 have class 2 obesity; adults with a BMI of 40 or greater have class 3 obesity, which is also known as extreme or severe obesity.[2] Children (persons aged 2 to 19 years) with a BMI at or above the 95th percentile of children of the same age and sex are defined as obese, and children with a BMI at or above the 85th percentile but less than the 95th percentile are defined as overweight.[3]
Compared to non-obese Americans, obese Americans incur an average of $1,429 more in medical expenses annually, and the obese American population spends approximately $147 billion per year in added medical expenses. However, some evidence suggests the lifetime cost of medical treatment for obese individuals is lower than for healthy weight individuals. This is because healthy weight people live longer statistically and tend to develop chronic diseases that need to be continually treated into old age, whereas obese people tend to die from metabolic diseases at younger ages and avoid some of those protracted medical costs.[4]
The obesity rate has steadily increased since the initial 1962 recording of 23%. By 2014, figures from the CDC found that more than one-third (crude estimate 36.5%) of U.S. adults[5][6] and 17% of children were obese.[7] The National Center for Health Statistics at the CDC showed in their most up to date statistics that 42.4% of U.S. adults were obese as of 2017-2018 (43% for men and 41.9% for women).[8]
For the following statistics, adults is defined as age 20 and over. The overweight + obese percentages for the overall US population are higher reaching 39.4% in 1997, 44.5% in 2004,[9] 56.6% in 2007,[10] 63.8% (adults) and 17% (children) in 2008,[11][12] in 2010 65.7% of American adults and 17% of American children are overweight or obese, and 63% of teenage girls become overweight by age 11.[13] In 2013 the Organization for Economic Co-operation and Development (OECD) found that 57.6% of all American citizens were overweight or obese. The organization estimates that 3/4 of the American population will likely be overweight or obese by 2020.[14] According to research done by the Harvard T.H. Chan School of Public Health, it is estimated that around 40% of Americans are considered obese, and 18% are considered severely obese as of 2019. Severe obesity is defined as a BMI over 35 in the study. Their projections say that about half of the US population (48.9%) will be considered obese and nearly 1 in 4 (24.2%) will be considered severely obese by the year 2030.[15][16]
Obesity has been cited as a contributing factor to approximately 53,754-170,064 deaths in the United States per year[17] and has increased health care use and expenditures,[18][19][20][21] costing society an estimated $117 billion in direct (preventive, diagnostic, and treatment services related to weight) and indirect (absenteeism, loss of future earnings due to premature death) costs.[22] This exceeds health care costs associated with smoking[21] and accounts for 6% to 12% of national health care expenditures in the United States.[23][24]
Epidemiology[]
Obesity is a chronic health problem. It is one of the biggest factors for type II diabetes and cardiovascular disease. It is also associated with cancer (e.g. colorectal cancer), osteoarthritis, liver disease, sleep apnea, depression, and other medical conditions that affect mortality and morbidity.[25]
According to NHANES data, African American and Mexican American adolescents between 12 and 19 years old are more likely to be overweight than non-Hispanic White adolescents. The prevalence is 21%, 23% and 14% respectively. Also, in a national survey of American Indian children 5–18 years old, 39 percent were found to be overweight or at risk for being overweight.[26] As per national survey data, these trends indicate that by 2030, 86.3% of adults will be overweight or obese and 51.1% obese.[27]
A 2007 study found that receiving food stamps long term (24 months) was associated with a 50% increased obesity rate among female adults.[28]
Looking at the long-term consequences, overweight adolescents have a 70 percent chance of becoming overweight or obese adults, which increases to 80 percent if one or more parent is overweight or obese. In 2000, the total cost of obesity for children and adults in the United States was estimated to be US$117 billion (US$61 billion in direct medical costs). Given existing trends, this amount is projected to range from US$860.7-956.9 billion in healthcare costs by 2030.[27]
Food consumption has increased over time. Annual per capita consumption of cheese was 4 pounds (1.8 kg) in 1909; 32 pounds (15 kg) in 2000; the average person consumed 389 grams (13.7 oz) of carbohydrates daily in 1970; 490 grams (17 oz) in 2000; 41 pounds (19 kg) of fats and oils in 1909; 79 pounds (36 kg) in 2000. In 1977, 18% of an average person's food was consumed outside the home; in 1996, this had risen to 32%.[29]
Contributing factors[]

Numerous studies have attempted to identify contributing factors for obesity in the United States. Common factors include an overconsumption of food and an insufficient amount of physical exercise. Eating properly can lower a person's body weight, but the public often fails to correctly determine what to eat and what not to eat as well as how much or how little they should. For example, while dieting, people tend to consume more low-fat or fat-free products, even though those items can be just as damaging to the body as the items containing fat. For the contributing factor of too little exercise, only a small amount (20%) of jobs require physical activity.[30]

Other factors not directly related to caloric intake and activity levels that are believed to contribute to obesity include air conditioning,[31] the ability to delay gratification, and the thickness of the prefrontal cortex of the brain.[32][better source needed][33] Genetics are also believed to be a factor, with a 2018 study stating that the presence of the human gene APOA2 could result in a higher BMI in individuals.[34] Also, the probability of obesity can even start before birth due to things that the mother does such as smoking and gaining a lot of weight.[30]
Effects on life expectancy[]
The United States' high obesity rate is a major contributor to its relatively low life expectancy relative to other high-income countries.[35] In the US, about 20% of cancer deaths in women and 14% of those in men are due to obesity.[36] It has been suggested that obesity may lead to a halt in the rise in life expectancy observed in the United States during the 19th and 20th centuries.[37][38] In the event that obesity continues to grow in newer generations, a decrease in well being and life span in the future generations may continue to degenerate. According to Olshansky, obesity diminishes "the length of life of people who are severely obese by an estimated 5 to 20 years."[37] History shows that the number of years lost will continue to grow because the likelihood of obesity in new generations is higher. Children and teens are now experiencing obesity at younger ages. They are eating less healthy and are becoming less active, possibly resulting in less time lived compared to their parents' .[37] The life expectancy for newer generations can expect to be lower due to obesity and the health risks they can experience at a later age.
Prevalence[]
The National Center for Health Statistics estimates that, for 2015–2016 in the U.S., 39.8% of adults aged 20 and over were obese (including 7.6% with severe obesity) and that another 31.8% were overweight.[39] In the NCHS update for 2018, statistics on severe obesity among U.S adults had already climbed to 9.2% while the total obesity prevalence had reached 42.4%. This also marked the first time in American history that the obesity rates had reached or exceeded 2/5 people in every adult age groups.[40]
Obesity rates have increased for all population groups in the United States over the last several decades.[17] Between 1986 and 2000, the prevalence of severe obesity (BMI ≥ 40 kg/m2) quadrupled from one in two hundred Americans to one in fifty. Extreme obesity (BMI ≥ 50 kg/m2) in adults increased by a factor of five, from one in two thousand to one in four hundred.[41]
There have been similar increases seen in children and adolescents, with the prevalence of overweight in pediatric age groups nearly tripling over the same period. Approximately nine million children over six years of age are considered obese. Several recent studies have shown that the rise in obesity in the US is slowing, possibly explained by saturation of health-oriented media.[41]
Race[]

Obesity is distributed unevenly across racial groups in the United States.[42] Overall, the prevalence of obesity and severe obesity was highest among non-Hispanic black adults and lowest among non-Hispanic Asian adults. The prevalence of obesity among men was not significantly different between non-Hispanic white, non-Hispanic black, and Hispanic men.[8] Some of these races tend to populate low socio-economic status neighborhoods and therefore can lack the resources such as safe play areas, as well as grocery stores with affordable fruits and vegetables. Furthermore, minority households can be more prone to obesity because of cultural food preferences and family norms.[43]
White
The obesity rate for White adults 18 years and older (over 30 BMI) in the US in 2015 was 29.7%.[44] For adult White men, the rate of obesity was 31.1% in 2015.[45] For adult White women, the rate of obesity was 27.5% in 2015.[45] The most recent statistics from the NHANES of age adjusted obesity rates for White adults 20 years and older in the U.S. in 2016 was 37.9%.[46] The obesity rates of White males and White females from the NHANES 2016 data were relatively equivalent, obesity rates were 37.9% and 38.0%, respectively.[47]
Black or African American[]
The obesity rate for Black adults 18 years and older (over 30 BMI) in the US in 2015 was 39.8%.[44] For adult Black men, the rate of obesity was 34.4% in 2015.[45] For adult Black women, the rate of obesity was 44.7% in 2015.[45] The most recent statistics from the NHANES of age adjusted obesity rates for Black adults 20 years and older in the U.S. in 2016 was 46.8%. [46] According to the obesity rates from the NHANES 2016 data, black males had significantly lower than black females, their rates were 36.9% and 54.8%, respectively.[47]
American Indian or Alaska Native[]
The obesity rate for American Indian or Alaska Native adults (over 30 BMI) in the US in 2015 was 42.9%.[44] No breakdown by sex was given for American Indian or Alaska Native adults in the CDC figures.[44]
Asian[]
The obesity rate for Asian adults 18 years and older (over 30 BMI) in the US in 2015 was 10.7%.[44] No breakdown by sex was given for Asian adults in the CDC figures.[44] In more recent statistics from the NHANES in 2016 of a breakdown by sex was provided. Asian adults 20 years and older had a total obesity rate of 12.7%. The rate among Asian males was 10.1% and among Asian females it was 14.8%. Asian Americans have substantially lower rates of obesity than any other racial or ethnic group.
Hispanic or Latino[]
The obesity rate for the Hispanic or Latino adults 18 years and older category (over 30 BMI) in the US in 2015 was 31.8%.[44] For the overall Hispanic or Latino men category, the rate of obesity was 31.6% in 2015.[45] For the overall Hispanic or Latino women category, the rate of obesity was 31.9% in 2015.[45] According to the most recent statistics from the NHANES in 2016 Latino adults had the highest overall obesity rates. Latino Adults age 20 and older had reached an obesity rate of 47.0%.[46] Adult Latino men's rate was 43.1%, the highest of all males. For adult Latina women the rate was 50.6%, making them second to African-American women.[47]
Mexican or Mexican Americans[]
Within the Hispanic or Latino category, obesity statistics for Mexican or Mexican Americans were provided, with no breakdown by sex.[44] The obesity rate for Mexican or Mexican Americans adults (over 30 BMI) in the US in 2015 was 35.2%.[44]
Native Hawaiian or other Pacific Islander[]
The obesity rate for Native Hawaiian or other Pacific Islander adults (over 30 BMI) in the US in 2015 was 33.4%.[44] No breakdown by sex was given for Native Hawaiian or other Pacific Islander adults in the CDC figures.[44]
Sex[]
Over 70 million adults in U.S. are obese (35 million men and 35 million women). 99 million are overweight (45 million women and 54 million men).[48] NHANES 2016 statistics showed that about 39.6% of American adults were obese. Men had an age-adjusted rate of 37.9% and Women had an age-adjusted rate of 41.1%.[46]
The CDC provided a data update in May 2017 stating that for adults 20 years and older, the crude obesity rate was 39.8% and the age adjusted rate was measured to be 39.7%. Including the obese, 71.6% of all American adults age 20 and above were overweight.[49][50]
Age[]
Historically, obesity primarily affected adults, but childhood obesity has grown significantly in recent decades. From the mid-1980s to the mid-2010s, obesity roughly doubled among U.S. children ages 2 to 5 and roughly tripled among young people over the age of 6.[51] Overall, obesity in the United States peaks during the middle aged years. During the period 2015–16, the prevalence of obesity among adults aged 20–39 was 35.7%, among those aged 40–59, 42.8%, and among those 60 and over, 41.0%.[52]
Newborns[]
Mothers who are obese and become pregnant have a higher risk of complications during pregnancy and during birth, and their newborns are at greater risk for preterm birth, birth defects, and perinatal death. There are more possible risks to children born to obese mothers than pregnant women who are not obese. Newborns are also at risk for neurodevelopmental issues. Obese women are in the position to possibly put their child at risk for compromised neurodevelopmental outcomes. It is not known the whole effect that obesity can have on the neurodevelopment of the child. Reports concluded that "children born to mothers with gestational diabetes, which is linked with maternal obesity, are at a higher risk for lower cognitive test scores and behavioral problems."[53] Obese women are less likely to breastfeed their newborns, and those who start doing so are likely to stop sooner.[54] Children who were breastfed every extra week by age 2 had a lower chance of being obese if the hospitals were informative about breastfeeding with mothers or if mothers chose to breastfeed that played a role in the child's weight.[55][non-primary source needed]
Children and teens[]
From 1980 to 2008, the prevalence of obesity in children aged 6 to 11 years tripled from 6.5% to 19.6%. The prevalence of obesity in teenagers more than tripled from 5% to 18.1% in the same time frame.[56] In less than one generation, the average weight of a child has risen by 5 kg in the United States.[57] In 2014 it was reported 17.2% of youth aged 2–19 were considered obese and another 16.2% were overweight.[58] Meaning, over one-third of children and teens in the US were overweight or obese. Statistics from a 2016-2017 page on the CDC's official website that 13.9% of toddlers and children age 2–5, 18.4% of children 6-11, and 20.6% of adolescents 12-19 are obese.[50] The prevalence of child obesity in today's society concerns health professionals because a number of these children develop health issues that weren't usually seen until adulthood.[59]
Some of the consequences in childhood and adolescent obesity are psychosocial. Overweight children and overweight adolescents are targeted for social discrimination, and thus, they begin to stress-eat.[60] The psychological stress that a child or adolescent can endure from social stigma can cause low self-esteem which can hinder a child's after school social and athletic capability, especially in plump teenage girls, and could continue into adulthood.[61] Teenage females are often overweight or obese by age 12, as, after puberty, teenage girls gain about 15 pounds, specifically in the arms, legs, and chest/midsection.[citation needed]
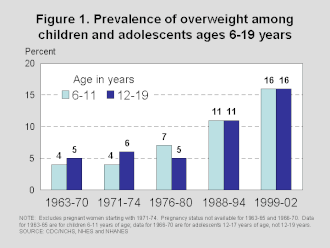
Data from NHANES surveys (1976–1980 and 2003–2006) show that the prevalence of obesity has increased: for children aged 2–5 years, prevalence increased from 5.0% to 12.4%; for those aged 6–11 years, prevalence increased from 6.5% to 19.6%; and for those aged 12–19 years, prevalence increased from 5.0% to 17.6%.[62]
In 2000, approximately 39% of children (ages 6–11) and 17% of adolescents (ages 12–19) were overweight and an additional 15% of children and adolescents were at risk of becoming overweight, based on their BMI.[63]
Analyses of the trends in high BMI for age showed no statistically significant trend over the four time periods (1999–2000, 2001–2002, 2003–2004, and 2005–2006) for either boys or girls. Overall, in 2003–2006, 11.3% of children and adolescents aged 2 through 19 years were at or above the 97th percentile of the 2000 BMI-for-age growth charts, 16.3% were at or above the 95th percentile, and 31.9% were at or above the 85th percentile.[64]
Trend analyses indicate no significant trend between 1999–2000 and 2007–2008 except at the highest BMI cut point (BMI for age 97th percentile) among all 6- through 19-year-old boys. In 2007–2008, 9.5% of infants and toddlers were at or above the 95th percentile of the weight-for-recumbent-length growth charts. Among children and adolescents aged 2 through 19 years, 11.9% were at or above the 97th percentile of the BMI-for-age growth charts; 16.9% were at or above the 95th percentile; and 31.7% were at or above the 85th percentile of BMI for age.[65]
In summary, between 2003 and 2006, 11.3% of children and adolescents were obese and 16.3% were overweight. A slight increase was observed in 2007 and 2008 when the recorded data shows that 11.9% of the children between 6 and 19 years old were obese and 16.9% were overweight. The data recorded in the first survey was obtained by measuring 8,165 children over four years and the second was obtained by measuring 3,281 children.
"More than 80 percent of affected children become overweight adults, often with lifelong health problems."[66] Children are not only highly at risk of diabetes, high cholesterol and high blood pressure but obesity also takes a toll on the child's psychological development. Social problems can arise and have a snowball effect, causing low self-esteem which can later develop into eating disorders.
Adults[]
There are more obese US adults than those who are just overweight.[67] According to a study in The Journal of the American Medical Association (JAMA), in 2008, the obesity rate among adult Americans was estimated at 32.2% for men and 35.5% for women; these rates were roughly confirmed by the CDC again for 2009–2010. Using different criteria, a Gallup survey found the rate was 26.1% for U.S. adults in 2011, up from 25.5% in 2008. Though the rate for women has held steady over the previous decade, the obesity rate for men continued to increase between 1999 and 2008, according to the JAMA study notes.[citation needed] Moreover, "The prevalence of obesity for adults aged 20 to 74 years increased by 7.9 percentage points for men and by 8.9 percentage points for women between 1976–1980 and 1988–1994, and subsequently by 7.1 percentage points for men and by 8.1 percentage points for women between 1988–1994 and 1999–2000."[68][69] According to the CDC, obesity has consistently remained the highest among middle-age adults since 2011. In the most recent update, 44.8% of Americans in their forties and fifties qualified as obese; meanwhile 40% of young adults and 42.4% of older adults were obese.[6][39][40]
Elderly[]
Although obesity is reported in the elderly, the numbers are still significantly lower than the levels seen in the young adult population. It is speculated that socioeconomic factors may play a role in this age group when it comes to developing obesity.[70] Obesity in the elderly increases healthcare costs.[clarification needed] Nursing homes are not equipped with the proper equipment needed to maintain a safe environment for the obese residents.[citation needed] If a heavy bedridden patient is not turned, the chances of a bed sore increases. If the sore is untreated, the patient will need to be hospitalized and have a wound vac placed.[71]
Prevalence by state and territory[]


The following figures were averaged from 2005 to 2007 adult data compiled by the CDC BRFSS program[72] and 2003–2004 child data[A] from the National Survey of Children's Health.[73][74] There is also data from a more recent 2016 CDC study of the 50 states plus the District of Columbia, Puerto Rico, the U.S. Virgin Islands and Guam.[75]
Care should be taken in interpreting these numbers, because they are based on self-report surveys which asked individuals (or, in case of children and adolescents, their parents) to report their height and weight. Height is commonly overreported and weight underreported, sometimes resulting in significantly lower estimates. One study estimated the difference between actual and self-reported obesity as 7% among males and 13% among females as of 2002, with the tendency to increase.[76]
The long-running REGARDS study, published in the journal of Obesity in 2014, brought in individuals from the nine census regions and measured their height and weight. The data collected disagreed with the data in the CDC's phone survey used to create the following chart. REGARDS found that the West North Central region (North Dakota, South Dakota, Minnesota, Missouri, Nebraska, and Iowa), and East North Central region (Illinois, Ohio, Wisconsin, Michigan, and Indiana) were the worst in obesity numbers, not the East South Central region (Tennessee, Mississippi, Alabama, Kentucky) as had been previously thought.[77] Dr. P.H., professor in the Department of Biostatistics in the UAB School of Public Health George Howard explains that "Asking someone how much they weigh is probably the second worst question behind how much money they make," "From past research, we know that women tend to under-report their weight, and men tend to over-report their height." Howard said as far as equivalency between the self-reported and measured data sets, the East South Central region showed the least misreporting. "This suggests that people from the South come closer to telling the truth than people from other regions, perhaps because there's not the social stigma of being obese in the South as there is in other regions."[78]
The area of the United States with the highest obesity rate is American Samoa (75% obese and 95% overweight).[79]
| States, district, & territories |
Obesity rank | Obese adults (mid-2000s) | Obese adults (2020)[80][75][81] | Overweight (incl. obese) adults (mid-2000s) |
Obese children and adolescents (mid-2000s)[82] |
|---|---|---|---|---|---|
| 5 | 30.1% | 36.3% | 65.4% | 16.7% | |
| 9 | 27.3% | 34.2% | 64.5% | 11.1% | |
| — | — | 75%[79] | 95%[83] | 35%[79][84] | |
| 30 | 23.3% | 29.5% | 59.5% | 12.2% | |
| 7 | 28.1% | 35.0% | 64.7% | 16.4% | |
| 48 | 23.1% | 25.1% | 59.4% | 13.2% | |
| 51 | 21.0% | 22.6% | 55.0% | 9.9% | |
| 42 | 20.8% | 26.9% | 58.7% | 12.3% | |
| 23 | 25.9% | 31.8% | 63.9% | 22.8% | |
| 50 | 22.1% | 23.0% | 55.0% | 14.8% | |
| 35 | 23.3% | 28.4% | 60.8% | 14.4% | |
| 24 | 27.5% | 31.6% | 63.3% | 16.4% | |
| — | — | 28.3% | — | 22%[85] | |
| 49 | 20.7% | 23.8% | 55.3% | 13.3% | |
| 32 | 24.6% | 29.3% | 61.4% | 10.1% | |
| 27 | 25.3% | 31.1% | 61.8% | 15.8% | |
| 12 | 27.5% | 33.6% | 62.8% | 15.6% | |
| 4 | 26.3% | 36.4% | 63.4% | 12.5% | |
| 18 | 25.8% | 32.4% | 62.3% | 14.0% | |
| 8 | 28.4% | 34.3% | 66.8% | 20.6% | |
| 6 | 29.5% | 36.2% | 64.2% | 17.2% | |
| 33 | 23.7% | 29.1% | 60.8% | 12.7% | |
| 26 | 25.2% | 31.3% | 61.5% | 13.3% | |
| 44 | 20.9% | 25.9% | 56.8% | 13.6% | |
| 19 | 27.7% | 32.3% | 63.9% | 14.5% | |
| 35 | 24.8% | 28.4% | 61.9% | 10.1% | |
| 2 | 34.4% | 37.3% | 67.4% | 17.8% | |
| 17 | 27.4% | 32.5% | 63.3% | 15.6% | |
| 46 | 21.7% | 25.3% | 59.6% | 11.1% | |
| 15 | 26.5% | 32.8% | 63.9% | 11.9% | |
| 43 | 23.6% | 26.7% | 61.8% | 12.4% | |
| 38 | 23.6% | 28.1% | 60.8% | 12.9% | |
| 41 | 22.9% | 27.3% | 60.5% | 13.7% | |
| 35 | 23.3% | 28.4% | 60.3% | 16.8% | |
| 45 | 23.5% | 25.7% | 60.0% | 15.3% | |
| 20 | 27.1% | 32.1% | 63.4% | 19.3% | |
| 13 | 25.9% | 33.2% | 64.5% | 12.1% | |
| — | — | — | — | 16%[86] | |
| 11 | 26.9% | 33.8% | 63.3% | 14.2% | |
| 3 | 28.1% | 36.5% | 64.2% | 15.4% | |
| 31 | 25.0% | 29.4% | 60.8% | 14.1% | |
| 24 | 25.7% | 31.6% | 61.9% | 13.3% | |
| — | — | 30.7% | — | 26%[87][88] | |
| 29 | 21.4% | 30.0% | 60.4% | 11.9% | |
| 10 | 29.2% | 34.1% | 65.1% | 18.9% | |
| 22 | 26.1% | 31.9% | 64.2% | 12.1% | |
| 15 | 29.0% | 32.8% | 65.0% | 20.0% | |
| 14 | 27.2% | 33.0% | 64.1% | 19.1% | |
| 46 | 21.8% | 25.3% | 56.4% | 8.5% | |
| 40 | 21.1% | 27.6% | 56.9% | 11.3% | |
| — | — | 32.5% | — | — | |
| 28 | 25.2% | 30.1% | 61.6% | 13.8% | |
| 39 | 24.5% | 27.7% | 60.7% | 10.8% | |
| 1 | 30.6% | 38.1% | 66.8% | 20.9% | |
| 21 | 25.5% | 32.0% | 62.4% | 13.5% | |
| 34 | 24.0% | 28.8% | 61.7% | 8.7% |
^ Except territories, whose data is from the late 2000s to 2010s
Total costs to the US[]
There has been an increase in obesity-related medical problems, including type II diabetes, hypertension, cardiovascular disease, and disability.[89][18] In particular, diabetes has become the seventh leading cause of death in the United States,[90] with the U.S. Department of Health and Human Services estimating in 2008 that fifty-seven million adults aged twenty and older were pre-diabetic, 23.6 million diabetic, with 90–95% of the latter being type 2-diabetic.[91]
Obesity has also been shown to increase the prevalence of complications during pregnancy and childbirth. Babies born to obese women are almost three times as likely to die within one month of birth and almost twice as likely to be stillborn than babies born to women of normal weight.[92]
Obesity has been cited as a contributing factor to approximately 100,000–400,000 deaths in the United States per year[17] (including increased morbidity in car accidents)[93] and has increased health care use and expenditures,[18][19][20][21] costing society an estimated $117 billion in direct (preventive, diagnostic, and treatment services related to weight) and indirect (absenteeism, loss of future earnings due to premature death) costs.[22] This exceeds health-care costs associated with smoking or problem drinking[21] and, by one estimate, accounts for 6% to 12% of national health care expenditures in the United States[23] (although another estimate states the figure is between 5% and 10%).[94]
The Medicare and Medicaid programs bear about half of this cost.[21] Annual hospital costs for treating obesity-related diseases in children rose threefold, from US$35 million to US$127 million, in the period from 1979 to 1999,[95] and the inpatient and ambulatory healthcare costs increased drastically by US$395 per person per year.[20]
These trends in healthcare costs associated with pediatric obesity and its comorbidities are staggering, urging the Surgeon General to predict that preventable morbidity and mortality associated with obesity may surpass those associated with cigarette smoking.[19][96] Furthermore, the probability of childhood obesity persisting into adulthood is estimated to increase from approximately twenty percent at four years of age to approximately eighty percent by adolescence,[97] and it is likely that these obesity comorbidities will persist into adulthood.[98]
In the military[]
An estimated 16% percent of active duty U.S. military personnel were obese in 2004, with the cost of remedial bariatric surgery for the military reaching US$15 million in 2002. Obesity is currently the largest single cause for the discharge of uniformed personnel.[99] A financial analysis published in 2007 further showed that the treatment of diseases and disorders associated with obesity costs the military $1.1 billion annually. Moreover, the analysis found that the increased absenteeism of obese or overweight personnel amounted to a further 658,000 work days lost per year. This lost productivity is higher than the productivity loss in the military due to high alcohol consumption which was found to be 548,000 work days. Problems associated with obesity further manifested itself in early discharge due to inability to meet weight standards. Approximately 1200 military enlistees were discharged due to this reason in 2006.[100]
The rise in obesity has led to fewer citizens able to join the military and therefore more difficulty in recruitment for the armed forces. In 2005, 9 million adults aged 17 to 24, or 27%, were too overweight to be considered for service in the military.[101] For comparison, just 6% of military aged men in 1960 would have exceed the current weight standards of the U.S. military. Excess weight is the most common reason for medical disqualification and accounts for the rejection of 23.3% of all recruits to the military. Of those who failed to meet weight qualifications but still entered the military, 80% left the military before completing their first term of enlistment.[102] In light of these developments, organizations such as Mission: Readiness, made up of retired generals and admirals, have advocated for focusing on childhood health education to combat obesity's effect on the military.[103]
Accommodations[]
[104] Along with obesity came the accommodations made of American products. Child-safety seats in 2006 became modified for the 250,000 obese U.S. children ages six and below.[105] The obese incur extra costs for themselves and airlines when flying. Weight is a major component to the formula that goes into the planes take off and for it to successfully fly to the desired destination. Due to the weight limits taken in consideration for flight in 2000, airlines spent $275 million on 350 million additional gallons of fuel for compensation of additional weight to travel.[105] Accommodations have also been made in work place environments for workers, including those such as chairs with no armrests and access to work outside of the office.[106]
Anti-obesity efforts[]
The National Center for Health Statistics reported in November 2015:
Trends in obesity prevalence show no increase among youth since 2003–2004, but trends do show increases in both adults and youth from 1999–2000 through 2013–2014. No significant differences between 2011–2012 and 2013–2014 were seen in either youth or adults.[107]
Under pressure from parents and anti-obesity advocates, many school districts moved to ban sodas, junk foods, and candy from vending machines and cafeterias.[108] State legislators in California, for example, passed laws banning the sale of machine-dispensed snacks and drinks in elementary schools in 2003, despite objections by the California-Nevada Soft Drink Association. The state followed more recently with legislation to prohibit their soda sales in high schools starting July 1, 2009, with the shortfall in school revenue to be compensated by an increase in funding for school lunch programs.[109] A similar law passed by the Connecticut General Assembly in June 2005 was vetoed by governor Jodi Rell, who stated the legislation "undermines the control and responsibility of parents with school-aged children."[110]
In mid-2006, the American Beverage Association (including Cadbury, Coca-Cola, and PepsiCo) agreed to a voluntary ban on the sale of all high-calorie drinks and all beverages in containers larger than 8, 10 and 12 ounces in elementary, middle and high schools, respectively.[111][112]
Non-profit organizations such as HealthCorps work to educate people on healthy eating and advocate for healthy food choices in an effort to combat obesity.[113]
Former American First Lady Michelle Obama led an initiative to combat childhood obesity entitled "Let's Move!". Obama said she aimed to wipe out obesity "in a generation". Let's Move! has partnered with other programs.[114] Walking and bicycling to school helps children increase their physical activity.[25]
In 2008, the state of Pennsylvania enacted a law, the "School Nutrition Policy Initiative," aimed at the elementary level. These "interventions included removing all sodas, sweetened drinks, and unhealthy snack foods from selected schools, 'social marketing' to encourage the consumption of nutritious foods and outreach to parents."[115] The results were a "50 percent drop in incidence of obesity and overweight", as opposed to those individuals who were not part of the study.[115]
In the past decade, there have been school-based programs that target the prevention and management of childhood obesity. There is evidence that long term school-based programs have been effective in reducing the prevalence of childhood obesity.[116]
For two years, Duke University psychology and global health professor Gary Bennett and eight colleagues followed 365 obese patients who had already developed hypertension. They found that regular medical feedback, self-monitoring, and a set of personalized goals can help obese patients in a primary care setting lose weight and keep it off.[117]
Major U.S. manufacturers of processed food, aware of the possible contribution of their products to the obesity epidemic, met together and discussed the problem as early as April 8, 1999; however, a proactive strategy was considered and rejected. As a general rule, optimizing the amount of salt, sugar and fat in a product will improve its palatability, and profitability. Reducing salt, sugar and fat, for the purpose of public health, had the potential to decrease palatability and profitability.[118]
Media influence may play an important role in prevention of obesity as it has the ability to boost many of the main prevention/intervention methods used nowadays including lifestyle modification. The media is also highly influential on children and teenagers as it promotes healthy body image and sets societal goals for lifestyle improvement. Examples of media influence are support for the "Let's Move!" campaign and the MyPlate program initiated by Michelle Obama, and the NFL's Play60 campaign. These campaigns promote physical activity in an effort to reduce obesity especially for children.[119]
In 2011, the Obama administration introduced a $400 million Healthy Food Financing Initiative, the goal of the program is to "create jobs and economic development, and establish market opportunities for farmers and ranchers," as described by the secretary of agriculture, Tom Vilsack.[120]
Food labeling[]
Ultimately, federal and local governments in the U.S. are willing to create political solutions that will reduce obesity ratings by "recommending nutrition education, encouraging exercise, and asking the food and beverage industry to promote healthy practices voluntarily."[115] In 2008, New York City was the first city to pass a "labeling bill" that "require[d] restaurants" in several cities and states to "post the caloric content of all regular menu items, in a prominent place and using the same font and format as the price."[115]
See also[]
- EPODE International Network, the world's largest obesity-prevention network
- Fat acceptance movement
- Hunger in the United States
- List of countries by Body Mass Index (BMI)
- Obesogen
- World Fit, a program of the United States Olympic Committee
Documentaries[]
References[]
- ^ "About Adult BMI". Retrieved March 17, 2020.
- ^ "Defining Adult Overweight and Obesity". Retrieved March 17, 2020.
- ^ "Defining Childhood Obesity". CDC. Retrieved August 17, 2019.
- ^ van Baal, Pieter H. M; Polder, Johan J; de Wit, G. Ardine; Hoogenveen, Rudolf T; Feenstra, Talitha L; Boshuizen, Hendriek C; Engelfriet, Peter M; Brouwer, Werner B. F (February 2008). "Lifetime Medical Costs of Obesity: Prevention No Cure for Increasing Health Expenditure". PLoS Medicine. 5 (2). doi:10.1371/journal.pmed.0050029. ISSN 1549-1277. PMC 2225430. PMID 18254654.
- ^ Ogden, Cynthia (November 2015). "Prevalence of Obesity Among Adults and Youth: United States, 2011–2014" (PDF). CDC. Retrieved June 22, 2020.
- ^ Jump up to: a b "Adult Obesity Facts". Centers for Disease Control and Prevention. Retrieved November 22, 2015.
- ^ "Childhood Obesity Facts". Centers for Disease Control and Prevention. Retrieved November 22, 2015.
- ^ Jump up to: a b Hales CM, Carroll MD, Fryar CD, Ogden CL (2020). Prevalence of Obesity Among Adults and Youth: United States, 2017–2018 (PDF) (NCHS data brief, no. 360). Hyattsville, MD: National Center for Health Statistics. Retrieved May 6, 2020 – via www.cdc.gov.
- ^ "Early Release of Selected Estimates Based on Data From the 2004 National Health Interview Survey" (PDF). CDC NCHS. June 21, 2005. Retrieved March 15, 2008. Cite journal requires
|journal=(help) - ^ "Early Release of Selected Estimates Based on Data From the January–June 2007 National Health Interview Survey (12/2007)" (PDF). CDC NCHS. November 19, 2007. Retrieved March 15, 2008. Cite journal requires
|journal=(help) - ^ "Table 71" (PDF). Centers for Disease Control and Prevention. Retrieved October 14, 2017.
- ^ "U.S. Obesity trends". Center for Disease Control. Archived from the original on May 10, 2013. Retrieved July 23, 2011.
- ^ "National Obesity Trends". CDC NCHS. 2010. Archived from the original on August 25, 2009. Retrieved March 26, 2012. Cite journal requires
|journal=(help) - ^ "The 10 Healthiest States in America". University of Illinois at Chicago. July 15, 2014. Retrieved September 18, 2014.
- ^ "Close to half of U.S. population projected to have obesity by 2030". Harvard Gazette. December 18, 2019. Retrieved March 13, 2020.
- ^ Ward ZJ, Bleich, SN, Cradock AL, Barrett JL, Giles CM, Flax C, Long MW, and Gortmaker SL (2019). "Projected U.S. State-Level Prevalence of Adult Obesity and Severe Obesity". The New England Journal of Medicine. 381 (25): 2440–50. doi:10.1056/NEJMsa1909301. PMID 31851800.CS1 maint: uses authors parameter (link)
- ^ Jump up to: a b c Blackburn GL, Walker WA (July 2005). "Science-based solutions to obesity: what are the roles of academia, government, industry, and health care?". The American Journal of Clinical Nutrition. 82 (Suppl 1): 207S–210S. doi:10.1093/ajcn/82.1.207S. PMID 16002821.
- ^ Jump up to: a b c Andreyeva T, Sturm R, Ringel JS (December 2004). "Moderate and severe obesity have large differences in health care costs". Obesity Research. 12 (12): 1936–43. doi:10.1038/oby.2004.243. PMID 15687394.
- ^ Jump up to: a b c Wolf AM (April 1998). "What is the economic case for treating obesity?". Obesity Research. 6 (Suppl 1): 2S–7S. doi:10.1002/j.1550-8528.1998.tb00682.x. PMID 9569170.
- ^ Jump up to: a b c Sturm R (2002). "The effects of obesity, smoking, and drinking on medical problems and costs". Health Affairs. 21 (2): 245–53. doi:10.1377/hlthaff.21.2.245. PMID 11900166.
- ^ Jump up to: a b c d e Finkelstein EA, Fiebelkorn IC, Wang G (2003). "National Medical Spending Attributable To Overweight And Obesity: How Much, And Who's Paying?". Health Affairs. 3 (1): 219–226. doi:10.1377/hlthaff.w3.219. PMID 14527256. S2CID 7620808.
- ^ Jump up to: a b "Statistics related to overweight and obesity: Economic costs related to overweight and obesity". Weight-control Information Network. 2006. Retrieved February 22, 2009.
- ^ Jump up to: a b Thompson D, Wolf AM (August 2001). "The medical-care cost burden of obesity". Obesity Reviews. 2 (3): 189–97. doi:10.1046/j.1467-789x.2001.00037.x. PMID 12120104. S2CID 7051598.
- ^ Fuhrman, Joel (April 3, 2018). "The Hidden Dangers of Fast and Processed Food". American Journal of Lifestyle Medicine. 12 (5): 375–381. doi:10.1177/1559827618766483. ISSN 1559-8276. PMC 6146358. PMID 30283262.
- ^ Jump up to: a b Rippe, James (2012). Obesity: Prevention and Treatment. Boca Raton: CRC Press. ISBN 978-1-4398-3671-2.
- ^ "Childhood Obesity". Retrieved March 31, 2010.
- ^ Jump up to: a b Wang Y, Beydoun MA, Liang L, Caballero B, Kumanyika SK (October 2008). "Will all Americans become overweight or obese? estimating the progression and cost of the US obesity epidemic". Obesity. 16 (10): 2323–30. doi:10.1038/oby.2008.351. PMID 18719634. S2CID 40159882.
- ^ "The Effects of Food Stamps on Obesity". Retrieved June 2, 2012.
- ^ Smith, Peter (August 2011). "Eat your veggies". Sky (Delta). pp. 52–53.
- ^ Jump up to: a b "Why are Americans Obese?". PublicHealth.org. Retrieved February 26, 2019.
- ^ Moellering DR, Smith DL (March 2012). "Ambient Temperature and Obesity". Current Obesity Reports. 1 (1): 26–34. doi:10.1007/s13679-011-0002-7. PMC 3975627. PMID 24707450.CS1 maint: uses authors parameter (link)
- ^ "The link between obesity, the brain, and genetics: When it comes to weight gain, the problem may be mostly in our heads, and our genes". ScienceDaily. Retrieved September 27, 2018.
- ^ Bray MS, Loos RJ, McCaffery JM, Ling C, Franks PW, Weinstock GM, Snyder MP, Vassy JL, Agurs-Collins T (January 2016). "NIH working group report-using genomic information to guide weight management: From universal to precision treatment". Obesity. 24 (1): 14–22. doi:10.1002/oby.21381. PMC 4689320. PMID 26692578.CS1 maint: uses authors parameter (link)

- ^ "International Research Team Finds Correlation Between Genetics and Obesity Is Modified by Diet". USDA Agricultural Research Service. Retrieved September 27, 2018.
- ^ Preston SH, Stokes A (November 2011). "Contribution of obesity to international differences in life expectancy". American Journal of Public Health. 101 (11): 2137–43. doi:10.2105/AJPH.2011.300219. PMC 3222401. PMID 21940912.
- ^ Ostrand-Rosenberg, Suzanne (March 4, 2021). "Myeloid-Derived Suppressor Cells: Facilitators of Cancer and Obesity-Induced Cancer". Annual Review of Cancer Biology. 5 (1): 17–38. doi:10.1146/annurev-cancerbio-042120-105240. ISSN 2472-3428.
- ^ Jump up to: a b c Olshansky SJ, Passaro DJ, Hershow RC, Layden J, Carnes BA, Brody J, Hayflick L, Butler RN, Allison DB, Ludwig DS (March 2005). "A potential decline in life expectancy in the United States in the 21st century". The New England Journal of Medicine. 352 (11): 1138–45. doi:10.1056/NEJMsr043743. PMID 15784668.
- ^ Stewart ST, Cutler DM, Rosen AB (December 2009). "Forecasting the effects of obesity and smoking on U.S. life expectancy". The New England Journal of Medicine. 361 (23): 2252–60. doi:10.1056/NEJMsa0900459. PMC 4394736. PMID 19955525.
- ^ Jump up to: a b Cheryl D. Fryar; et al. (September 2018). "Prevalence of Overweight, Obesity, and Severe Obesity Among Adults Aged 20 and Over: United States, 1960–1962 Through 2015–2016" (PDF). Health E-Stats. National Center for Health Statistics, Division of Health Interview Statistics. Retrieved December 26, 2018.
- ^ Jump up to: a b Hales, Craig (February 27, 2020). "Prevalence of Obesity and Severe Obesity Among Adults: United States, 2017–2018" (PDF). CDC. Retrieved June 23, 2020.
- ^ Jump up to: a b "U.S. obesity rates reaching a resting point, studies show". Los Angeles Times. January 14, 2010. Retrieved October 14, 2017.
- ^ "CDC Summary Health Statistics: National Health Interview Survey, 2015" (PDF). Cdc.gov. United States, U.S. Department of Health and Human Services, Centers for Disease Control and Prevention, National Center for Health Statistics. 2015. Retrieved October 14, 2017.
- ^ Wippold, G. M., & Tucker, C. M. (2016, June). Childhood obesity disparities: Influential factors and intervention strategies. Retrieved from https://www.apa.org/pi/families/resources/newsletter/2016/06/childhood-obesity
- ^ Jump up to: a b c d e f g h i j k "CDC 2015. Summary Health Statistics for U.S. Adults: 2015. Table A-15a" (PDF). Cdc.gov. p. 7. Retrieved October 14, 2017.
- ^ Jump up to: a b c d e f "CDC 2015. Summary Health Statistics for U.S. Adults: 2015. Table A-15a" (PDF). Cdc.gov. p. 9. Retrieved October 14, 2017.
- ^ Jump up to: a b c d "StateofObesity 2016. Percent of Adults 2016. NHANES Table" (PDF). stateofobesity.org. p. 16. Retrieved February 28, 2019.
- ^ Jump up to: a b c "StateofObesity 2016. Percent of Adults 2016. NHANES Table" (PDF). stateofobesity.org. p. 17. Retrieved February 28, 2019.
- ^ "Summary Health Statistics: National Health Interview Survey, 2015" (PDF). Table A-15b.
- ^ "SelectedHealthConditionsandRiskFactorsbyage" (PDF). 2017. Table 53.
- ^ Jump up to: a b "Obesity and Overweight". National Center for Health Statistics. May 3, 2017.
- ^ "Children's Health: Obesity". NIH. March 16, 2015.
- ^ Hales, CM; Carroll, MD; Fryar, CD; Ogden, CL (2017). "Prevalence of Obesity Among Adults and Youth: United States, 2015–2016" (PDF). NCHS Data Brief. National Center for Health Statistics. 288.
- ^ Sanchez CE, Barry C, Sabhlok A, Russell K, Majors A, Kollins SH, Fuemmeler BF (2018). "Maternal pre‐pregnancy obesity and child neurodevelopmental outcomes: a meta‐analysis". Obesity Reviews. 19 (4): 464–484. doi:10.1111/obr.12643. PMC 6059608. PMID 29164765.
- ^ Marchi J, Berg M, Dencker A, Olander EK, Begley C (August 2015). "Risks associated with obesity in pregnancy, for the mother and baby: a systematic review of reviews" (PDF). Obesity Reviews. 16 (8): 621–38. doi:10.1111/obr.12288. hdl:2262/75578. PMID 26016557. S2CID 206228471.
- ^ Modrek S, Basu S, Harding M, White JS, Bartick MC, Rodriguez E, Rosenberg KD (2017). "Does breastfeeding duration decrease child obesity? An instrumental variables analysis". Pediatric Obesity. 12 (4): 304–311. doi:10.1111/ijpo.12143. PMC 6588354. PMID 27161761.
- ^ "Childhood Obesity Statistics". Archived from the original on April 9, 2010. Retrieved March 31, 2010.
- ^ Antonelli JA, Maalouf NM, Pearle MS, Lotan Y (October 2014). "Use of the National Health and Nutrition Examination Survey to calculate the impact of obesity and diabetes on cost and prevalence of urolithiasis in 2030". European Urology. 6 (4): 724–9. doi:10.1016/j.eururo.2014.06.036. PMC 4227394. PMID 25015037.
- ^ "Prevalence of Overweight and Obesity Among Children and Adolescents Aged 2–19 Years: United States, 1963–1965 Through 2013–2014". National Center for Health Statistics.
- ^ "American Heart Association". Retrieved November 24, 2014.
- ^ Dietz WH (March 1998). "Health consequences of obesity in youth: childhood predictors of adult disease". Pediatrics. 101 (3 Pt 2): 518–25. PMID 12224658.
- ^ Schwartz MB, Puhl R (February 2003). "Childhood obesity: a societal problem to solve". Obesity Reviews. 4 (1): 57–71. doi:10.1046/j.1467-789X.2003.00093.x. PMID 12608527. S2CID 17268050.
- ^ "Childhood Overweight and Obesity". Cdc.gov. Retrieved March 31, 2010.
- ^ "Obesity Statistics". Overweightteen.com. Retrieved March 31, 2010.
- ^ Ogden CL, Carroll MD, Flegal KM (May 2008). "High body mass index for age among US children and adolescents, 2003-2006". JAMA. 299 (20): 2401–5. doi:10.1001/jama.299.20.2401. PMID 18505949.
- ^ Ogden CL, Carroll MD, Curtin LR, Lamb MM, Flegal KM (January 2010). "Prevalence of high body mass index in US children and adolescents, 2007-2008". JAMA. 303 (3): 242–9. doi:10.1001/jama.2009.2012. PMID 20071470.
- ^ Berk, Laura E. (2010). Exploring Lifespan Development (2nd ed.). Boston: Allan & Bacon. ISBN 978-0-205-74859-4.
- ^ Deng T, Lyon CJ, Bergin S, Caligiuri MA, Hsueh WA (May 2016). "Obesity, Inflammation, and Cancer". Annual Review of Pathology. 11 (1): 421–49. doi:10.1146/annurev-pathol-012615-044359. PMID 27193454.
- ^ Wihbey, John (January 5, 2012). "U.S. Obesity Trends and Neighborhood Effects". Journalist's Resource. Harvard Shorenstein Center. Retrieved April 18, 2013.
- ^ "How Much Physical Activities Do Adults Need?". Centers for Disease Control and Prevention. Retrieved February 24, 2015.
- ^ "An overview on obesity". Emedicine Health. Retrieved February 4, 2010.
- ^ Bradway C, DiResta J, Fleshner I, Polomano RC (August 2008). "Obesity in nursing homes: a critical review". Journal of the American Geriatrics Society. 56 (8): 1528–35. doi:10.1111/j.1532-5415.2008.01821.x. PMID 18662208. S2CID 16573224.
- ^ Levi J, Vinter S, St Laurent R, Segal LM (August 2008). F as in Fat: How Obesity Policies are Failing in America, 2008 (PDF) (Report). Trust For America's Health. pp. 10–11. Archived from the original (PDF) on January 6, 2009.. Note: Defines "overweight" as BMI ≥25, "obese" as BMI ≥30
- ^ "Overweight and Physical Activity Among Children: A Portrait of States and the Nation 2005" (PDF). HRSA. 2005. Archived from the original (PDF) on August 3, 2011. Cite journal requires
|journal=(help). Note: data is for children aged 10-17; defines "overweight" as BMI ≥95th percentile. - ^ Blumberg SJ, Olson L, Frankel MR, Osborn L, Srinath KP, Giambo P (June 2005). "Design and Operation of the National Survey of Children's Health, 2003" (PDF). Vital and Health Statistics. Ser. 1, Programs and Collection Procedures. 1 (43): 1–131. PMID 25078122.
- ^ Jump up to: a b "Prevalence of Self-Reported Obesity Among U.S. Adults by State and Territory". CDC.gov. 2016. Retrieved January 17, 2018.
- ^ Ezzati M, Martin H, Skjold S, Vander Hoorn S, Murray CJ (May 2006). "Trends in national and state-level obesity in the USA after correction for self-report bias: analysis of health surveys". Journal of the Royal Society of Medicine. 99 (5): 250–7. doi:10.1258/jrsm.99.5.250. PMC 1457748. PMID 16672759.
- ^ "The Geographic Distribution of Obesity in the US and the Potential Regional Differences in Misreporting of Obesity". Regardsstudy.org. Retrieved October 14, 2017.
Note: study disagrees with findings of CDC cell phone survey, and obesity prevelence by state chart
- ^ Wyatt, Nicole (April 11, 2013). "South not the fattest part of U.S. after all, study say". UAB News. University of Alabama at Birmingham.
- ^ Jump up to: a b c Tracy, Ben (July 7, 2013). "Battling American Samoa's 75-percent obesity rate". CBS News. Retrieved January 17, 2018.
- ^ "Obesity Rate by State 2020". worldpopulationreview.com. Retrieved March 14, 2020.
- ^ Except American Samoa, which is 2013 data
- ^ Except territories, whose data is more recent.
- ^ "Mexico becomes the fattest nation on the planet by pushing America to number 2". Newseastwest.com. July 8, 2013. Retrieved January 17, 2018.
- ^ Average of 30% and 40%
- ^ "Kids' obesity rate dropping, remains high". Guampdn.com. January 31, 2015. Retrieved January 17, 2018.
- ^ "The Obesity Epidemic and Northern Mariana Islands Students" (PDF). CDC.gov. 2013. Retrieved January 17, 2018.
- ^ "Big Trouble In Little Puerto Rico: Obese Kids". NBC News. May 20, 2007. Archived from the original on October 8, 2015. Retrieved January 17, 2018.
- ^ Luscombe, Richard (March 8, 2015). "Puerto Rico law would brand parents of obese children 'child abusers'". The Guardian. Retrieved January 17, 2018.
- ^ Biener AI, Decker SL (January 2018). "Medical Care Use and Expenditures Associated With Adult Obesity in the United States". JAMA. 319 (3): 218. doi:10.1001/jama.2017.21063. PMID 29340665.
- ^ "Statistics About Diabetes". American Diabetes Association. Retrieved October 14, 2017.
- ^ "Diabetes Prevention Program" (PDF). Department of Health and Human Services. 2008. Archived from the original (PDF) on January 17, 2013. Retrieved May 4, 2009. Cite journal requires
|journal=(help) - ^ Hartocollis, Anemona (June 5, 2010). "Growing Obesity Increases Perils of Childbearing". The New York Times. Retrieved June 9, 2010.
- ^ Rice TM, Zhu M (January 2014). "Driver obesity and the risk of fatal injury during traffic collisions". Emergency Medicine Journal. 31 (1): 9–12. doi:10.1136/emermed-2012-201859. PMID 23337422. S2CID 41466012.
- ^ Tsai AG, Williamson DF, Glick HA (January 2011). "Direct medical cost of overweight and obesity in the USA: a quantitative systematic review". Obesity Reviews. 12 (1): 50–61. doi:10.1111/j.1467-789X.2009.00708.x. PMC 2891924. PMID 20059703.
- ^ Wang G, Dietz WH (May 2002). "Economic burden of obesity in youths aged 6 to 17 years: 1979-1999". Pediatrics. 109 (5): E81–1. doi:10.1542/peds.109.5.e81. PMID 11986487.
- ^ "The Surgeon General's call to action to prevent and decrease overweight and obesity" (PDF). U.S. Department of Health and Human Services. 2001. Retrieved February 22, 2008. Cite journal requires
|journal=(help) - ^ Guo, W C; Chumlea (March 27, 1999). "Tracking of body mass index in children in relation to overweight in adulthood". The American Journal of Clinical Nutrition. 70 (1): 145–148. doi:10.1093/ajcn/70.1.145s.
- ^ Byck GR (July 2000). "A comparison of the socioeconomic and health status characteristics of uninsured, state Children's health insurance program-eligible children in the united states with those of other groups of insured children: implications for policy". Pediatrics. 106 (1 Pt 1): 14–21. doi:10.1542/peds.106.1.e14. PMID 10878143.
- ^ Basu, Sandra (March 25, 2004). "Military Not Immune From Obesity Epidemic". U.S. Medicine. Retrieved April 24, 2014.
- ^ Dall, Timothy M.; Zhang, Yiduo; Chen, Yaozhu J.; Wagner, Rachel C. Askarinam; Hogan, Paul F.; Fagan, Nancy K.; Olaiya, Samuel T.; Tornberg, David N. (November 2007). "Cost Associated with Being Overweight and with Obesity, High Alcohol Consumption, and Tobacco Use within the Military Health System's TRICARE Prime—Enrolled Population". American Journal of Health Promotion. 22 (2): 120–139. doi:10.4278/0890-1171-22.2.120. ISSN 0890-1171. PMID 18019889. S2CID 46775056.
- ^ Shalikashvili, John M. (April 30, 2010). "The new national security threat: obesity". Washington Post. Washington, DC. p. A19.
- ^ Cawley, John; Maclean, Johanna Catherine (2012). "Unfit for Service: The Implications of Rising Obesity for Us Military Recruitment". Health Economics. 21 (11): 1348–1366. doi:10.1002/hec.1794. hdl:10419/52022. ISSN 1099-1050. PMID 21971919. S2CID 6579500.
- ^ Maxy, Heather; Bishop-Josef, Sandra (October 2018). "Unhealthy and Unprepared" (PDF). Council for a Strong America.
- ^ "Sleep Deprivation and Obesity". The Nutrition Source. Harvard T.H. Chan School of Public Health. September 18, 2012. Retrieved December 7, 2015.
- ^ Jump up to: a b Stahl, Jason (July 24, 2006). "20 Things You Didn't Know about... Obesity". Discover Magazine.
- ^ "Capitol One makes accommodations for Obese worker and condition". September 5, 2017.
- ^ "Products - Data Briefs - Number 219 - November 2015". Cdc.gov. Retrieved October 14, 2017.
- ^ Otto, Mary; Aratani, Lori (May 4, 2006). "Soda Ban Means Change at Schools". Washington Post. Retrieved March 8, 2008.
- ^ Finz, Stacy (May 22, 2006). "State high school soda ban expected on books by 2009". San Francisco Chronicle. Retrieved March 8, 2008.
- ^ Cowan, Alison Leigh (June 15, 2005). "Rell Vetoes Junk-Food Limit in Connecticut's Public Schools". The New York Times. Retrieved November 30, 2009.
- ^ Mayer, Caroline (May 3, 2006). "Sugary Drinks To Be Pulled From Schools: Industry Agrees to Further Limit Availability to Children". The Washington Post. Retrieved March 8, 2008.
- ^ Burros, Marian; Warner, Melania (May 4, 2006). "Bottlers Agree to a School Ban on Sweet Drinks". The New York Times. Retrieved March 8, 2008.
- ^ "Program Teaches Teens Proper Nutrition". ABC News. ABC News Internet Ventures. 2008.
- ^ "Fuel up to Play 60 | Kids In-School Health and Wellness Program". Archived from the original on February 4, 2011. Retrieved January 26, 2011.
- ^ Jump up to: a b c d Kersh R (March 2009). "The politics of obesity: a current assessment and look ahead". The Milbank Quarterly. 87 (1): 295–316. doi:10.1111/j.1468-0009.2009.00556.x. PMC 2879181. PMID 19298424.
- ^ Gonzalez-Suarez C, Worley A, Grimmer-Somers K, Dones V (November 2009). "School-based interventions on childhood obesity: a meta-analysis". American Journal of Preventive Medicine. 37 (5): 418–27. doi:10.1016/j.amepre.2009.07.012. PMID 19840696.
- ^ Cloud, John (March 14, 2012). "A Weight-Loss Solution: Don't Eat Less. Just Don't Eat More". Time. Retrieved December 4, 2013.
- ^ Moss, Michael (February 20, 2013). "The Extraordinary Science of Addictive Junk Food". The New York Times Magazine. Retrieved March 1, 2013.
- ^ Boles M, Adams A, Gredler A, Manhas S (October 2014). "Ability of a mass media campaign to influence knowledge, attitudes, and behaviors about sugary drinks and obesity". Preventive Medicine. 67 (Suppl 1): S40-5. doi:10.1016/j.ypmed.2014.07.023. PMID 25066020.
- ^ Holzman, DC (April 2010). "White House proposes healthy food financing initiative". Environmental Health Perspectives. 118 (4): A156. doi:10.1289/ehp.118-a156. PMC 2854743. PMID 20359982.
Further reading[]
- Knowlton, Laura (Autumn 2007). "Reading American Fat in France : Obesity and Food Culture". . 2 (2).
External links[]
| Wikimedia Commons has media related to Obesity maps of the United States. |
- Obesity in the United States