From Wikipedia, the free encyclopedia
1950 Japanese House of Councillors election|
|
|
|
|
First party
|
Second party
|
Third party
|
|
|

|
|
|
| Leader
|
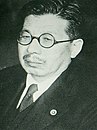
Shigeru Yoshida
|
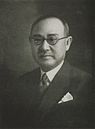
Tetsu Katayama
|
|
| Party
|
Liberal
|
Socialist
|
Ryokufūkai
|
| Seats after
|
76
|
61
|
50
|
| Popular vote
|
8,313,756
|
4,854,629
|
3,660,391
|
| Percentage
|
29.70%
|
17.34%
|
13.08%
|
|
|
|
Fourth party
|
Fifth party
|
Sixth party
|
|
|
|
|
|
| Leader
|
|
|
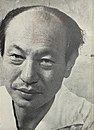
Kyuichi Tokuda
|
| Party
|
National Democratic
|
Labourers–Farmers
|
Communist
|
| Seats after
|
29
|
5
|
4
|
| Popular vote
|
1,368,783
|
200,066
|
1,333,872
|
| Percentage
|
4.89%
|
0.71%
|
4.76%
|
|
|
House of Councillors elections were held in Japan on 4 June 1950,[1] electing half the seats in the House. The Liberal Party won the most seats.
Results[]
| Party | National | Constituency | Seats |
|---|
| Votes | % | Seats | Votes | % | Seats | Not up | Won | Total
after | +/– |
|---|
| Liberal Party | 8,313,756 | 29.70 | 18 | 10,414,995 | 35.91 | 34 | 24 | 52 | 76 | New |
| Japan Socialist Party | 4,854,629 | 17.34 | 15 | 7,316,808 | 25.23 | 21 | 25 | 36 | 61 | +14 |
| National Democratic Party | 1,368,783 | 4.89 | 1 | 2,966,011 | 10.23 | 8 | 20 | 9 | 29 | New |
| Ryokufūkai | 3,660,391 | 13.08 | 6 | 1,773,576 | 6.11 | 3 | 41 | 9 | 50 | New |
| Japanese Communist Party | 1,333,872 | 4.76 | 2 | 1,637,451 | 5.65 | 0 | 2 | 2 | 4 | 0 |
| Labourers and Farmers Party | 200,066 | 0.71 | 1 | 471,649 | 1.63 | 1 | 3 | 2 | 5 | New |
| Other parties | 629,370 | 2.25 | 1 | 958,493 | 3.30 | 2 | 0 | 3 | 3 | – |
| Independents | 7,632,526 | 27.27 | 12 | 3,465,956 | 11.95 | 7 | 3 | 19 | 22 | –89 |
| Total | 27,993,393 | 100.00 | 56 | 29,004,939 | 100.00 | 76 | 118 | 132 | 250 | 0 |
|
| Valid votes | 27,993,393 | 89.22 | | 29,004,939 | 92.44 | | |
|---|
| Invalid/blank votes | 3,382,542 | 10.78 | | 2,371,573 | 7.56 | | |
|---|
| Total votes | 31,375,935 | 100.00 | | 31,376,512 | 100.00 | | |
|---|
| Registered voters/turnout | 43,461,371 | 72.19 | | 43,461,371 | 72.19 | | |
|---|
| Source: Ministry of Internal Affairs and Communications,[1][2] National Diet |
By constituency[]
References[]

Categories:
- House of Councillors (Japan) elections
- 1950 elections in Asia
- 1950 elections in Japan
- June 1950 events in Asia
Hidden categories:
- Webarchive template wayback links
- Election and referendum articles with incomplete results


