Ballon, Charente-Maritime
Ballon | |
|---|---|
 The village of Ballon | |
show Location of Ballon | |
 Ballon | |
| Coordinates: 46°03′28″N 0°57′04″W / 46.0578°N 0.9511°WCoordinates: 46°03′28″N 0°57′04″W / 46.0578°N 0.9511°W | |
| Country | France |
| Region | Nouvelle-Aquitaine |
| Department | Charente-Maritime |
| Arrondissement | Rochefort |
| Canton | Surgères |
| Government | |
| • Mayor (2020–2026) | Emmanuel Jobin[1] |
| Area 1 | 12.18 km2 (4.70 sq mi) |
| Population (Jan. 2018)[2] | 800 |
| • Density | 66/km2 (170/sq mi) |
| Time zone | UTC+01:00 (CET) |
| • Summer (DST) | UTC+02:00 (CEST) |
| INSEE/Postal code | 17032 /17290 |
| Elevation | 0–47 m (0–154 ft) (avg. 12 m or 39 ft) |
| 1 French Land Register data, which excludes lakes, ponds, glaciers > 1 km2 (0.386 sq mi or 247 acres) and river estuaries. | |

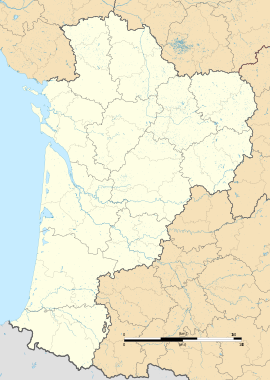

Ballon is a commune in the Charente-Maritime department, region of Nouvelle-Aquitaine, southwestern France.
The inhabitants of the commune are known as Ballonais or Ballonaises.[3]
Geography[]
Ballon is located some 12 km north of Rochefort and 6 km south of Aigrefeuille-d'Aunis. Access to the commune is by the D111 road from Thairé in the west which passes through the village and continues to Ciré-d'Aunis in the east. The D266 goes south-west from the village then west to join the D110 west of the commune. The commune is entirely farmland.[4]
The Canal de Charras forms the south-eastern border of the commune with the Canal des Roseaux joining it on the southern border and forming part of the south western border. In most of the commune - especially the south - there is an extensive network of canals including the Canal de Ceinture du Marais de Moullepieds and the Canal de Lileau.[4]
Neighbouring communes and villages[]
| show Places adjacent to Ballon, Charente-Maritime |
|---|
Administration[]

This list is incomplete; you can help by . (April 2021) |
| From | To | Name |
|---|---|---|
| 2001 | 2014 | Noël Gaynet |
| 2014 | 2020 | Emmanuel Devaud |
| 2020 | 2026 | Emmanuel Jobin |
Demography[]
In 2017 the commune had 795 inhabitants.
|
| ||||||||||||||||||||||||||||||||||||||||||||||||||||||||||||||||||||||||||||||||||||||||||||||||||||||||||||||||||
| Source: EHESS[6] and INSEE[7] | |||||||||||||||||||||||||||||||||||||||||||||||||||||||||||||||||||||||||||||||||||||||||||||||||||||||||||||||||||

Distribution of Age Groups[]
The population of the town is younger than the departmental average.
Percentage Distribution of Age Groups in Ballon and Charente-Maritime Department in 2017
| Ballon | Charente-Maritime | |||
|---|---|---|---|---|
| Age Range | Men | Women | Men | Women |
| 0 to 14 Years | 24.0 | 22.9 | 16.3 | 14.3 |
| 15 to 29 Years | 11.6 | 13.0 | 15.4 | 13.1 |
| 30 to 44 Years | 27.9 | 24.3 | 16.7 | 16.1 |
| 45 to 59 Years | 18.0 | 18.3 | 20.2 | 19.9 |
| 60 to 74 Years | 14.5 | 15.3 | 21.1 | 22.0 |
| 75 to 89 Years | 4.1 | 5.2 | 9.4 | 12.3 |
| 90 Years+ | 0.0 | 1.0 | 1.0 | 2.4 |
See also[]
External links[]
- Ballon on Lion1906
- Ballon on Géoportail, National Geographic Institute (IGN) website (in French)
- Ballon on the 1750 Cassini Map
References[]
- ^ "Répertoire national des élus: les maires". data.gouv.fr, Plateforme ouverte des données publiques françaises (in French). 2 December 2020. Retrieved 7 December 2020.
- ^ "Populations légales 2018". INSEE. 28 December 2020.
- ^ Inhabitants of Charente-Maritime (in French)
- ^ Jump up to: a b c Google Maps
- ^ List of Mayors of France (in French)
- ^ Des villages de Cassini aux communes d'aujourd'hui: Commune data sheet Ballon, EHESS. (in French)
- ^ Population en historique depuis 1968, INSEE
- ^ Évolution et structure de la population en 2017: Commune de Ballon (17032)
- ^ Évolution et structure de la population en 2017: Département de la Charente-Maritime (17)
| Wikimedia Commons has media related to Ballon (Charente-Maritime). |
- Communes of Charente-Maritime