Guanling Buyei and Miao Autonomous County
Guanling County
关岭县 | |
|---|---|
| 关岭布衣族苗族自治县 Guanling Buyei and Miao Autonomous County | |
 Guanling is the westernmost division on this map of Anshun | |
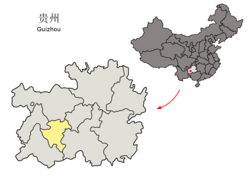 Anshun in Guizhou | |
| Coordinates (Guanling County government): 25°57′13″N 105°32′18″E / 25.9535°N 105.5383°ECoordinates: 25°57′13″N 105°32′18″E / 25.9535°N 105.5383°E[1] | |
| Country | People's Republic of China |
| Province | Guizhou |
| Prefecture-level city | Anshun |
| Area | |
| • Total | 1,470.49 km2 (567.76 sq mi) |
| Population (2010) | |
| • Total | 301,562 |
| • Density | 210/km2 (530/sq mi) |
| Time zone | UTC+8 (China Standard) |

Guanling Buyei and Miao Autonomous County (simplified Chinese: 关岭布依族苗族自治县; traditional Chinese: 關嶺布依族苗族自治縣) is an autonomous county in Anshun City, in the southwest of Guizhou Province, China.
Area: 1,466 km2 (566 sq mi)
Population: 334,900 in 2008.
Postal Code: 561300.
Telephone Area Code: 0853
The county government is located in Guansuo town.
Transportation[]
- Guanxing Highway
- China National Highway 320
- G60 Shanghai–Kunming Expressway
- Guanling railway station
Climate[]
| showClimate data for Guanling (1981−2010) |
|---|
References[]
- ^ 关岭自治县人民政府政务服务中心 - 高德地图. Amap. Retrieved 2020-05-24.
External links[]
| show Authority control |
|---|
Categories:
- Guanling Buyei and Miao Autonomous County
- County-level divisions of Guizhou
- Bouyei autonomous counties
- Miao autonomous counties