Henry County, Alabama
Henry County | |
|---|---|
U.S. county | |
 Henry County Courthouse in Abbeville | |
 Location within the U.S. state of Alabama | |
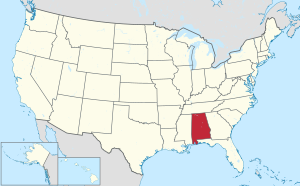 Alabama's location within the U.S. | |
| Coordinates: 31°30′46″N 85°14′04″W / 31.512777777778°N 85.234444444444°W | |
| Country | |
| State | |
| Founded | December 13, 1819 |
| Named for | Patrick Henry |
| Seat | Abbeville |
| Largest city | Headland |
| Area | |
| • Total | 568 sq mi (1,470 km2) |
| • Land | 562 sq mi (1,460 km2) |
| • Water | 6.6 sq mi (17 km2) 1.2% |
| Population (2020) | |
| • Total | 17,146 |
| • Density | 30/sq mi (12/km2) |
| Time zone | UTC−6 (Central) |
| • Summer (DST) | UTC−5 (CDT) |
| Congressional district | 2nd |
| Website | www |
| |

Henry County is a county in the southeastern part of the U.S. state of Alabama. As of the 2020 census, its population was 17,146.[1] Its county seat is Abbeville.[2] The county was named for Patrick Henry (1736–1799), famous orator and Governor of Virginia.[3]
Henry County is part of the Dothan, AL Metropolitan Statistical Area.
History[]
The area that includes Henry County had historically been occupied by people of the Lower Creek Confederacy, who now prefer to be known as the Muscogee. It was occupied for thousands of years before that by varying cultures of indigenous peoples who settled primarily along the waterways.
This area was colonized by various European powers, including France and Spain. After Great Britain defeated France in the Seven Years' War, it took over this area. Between 1763 and 1783, the area that is now Henry County, Alabama was under the jurisdiction of the colony of British West Florida. The United States acquired it from Britain after gaining independence in the American Revolutionary War.
After 1814, the territorial settlers developed Franklin as the first European-American settlement in Muscogee/Creek territory. The former river port served Abbeville on the Chattahoochee River. Much of Henry County was within the Alabama wiregrass region.[4]
Henry County was established on December 13, 1819 by the Alabama Territorial Legislature. The area was ceded by the Creek Indian Nation in 1814 under the Treaty of Fort Jackson. Henry County was formed before Alabama was organized as a state. Abbeville was designated as the county seat in 1833.
Henry County has been called "The Cradle of the Wiregrass". She is The Mother of nine other counties. When the county was formed December 1819, it was the largest county by area within Alabama and encompassed a vast land area that now includes the Southeast Alabama Wiregrass Region and beyond. As population increased in the region, areas of it were taken to organize the present counties of Barbour, Coffee, Covington, Crenshaw, Dale, Geneva, Houston, and Pike.
Timeline:
- December 7, 1821 - The first two counties created, in part, from Old Henry were Covington and Pike counties.
- December 29, 1824 - The third county was Dale which was carved, in whole, from Old Henry.
- December 18, 1832 - The fourth county to be created was Barbour County which was formed, in part, from Pike County. When Barbour County was created, Henry County gained a small parcel of land from the White Oak Creek area.
- December 29, 1841 - The fifth county to be created was Coffee County, which was formed in part from Dale County.
- December 6, 1866 - The sixth was Bullock County, which was created with the southern tip of the county indirectly coming from Old Henry.
- December 24, 1866 - The seventh county to be created was Crenshaw County which was formed, in part, from Coffee, Covington and Pike counties.
- December 28, 1868 - The eighth county to be created was Geneva County which was formed, in part, from Henry, Dale and Coffee counties.
- February 9, 1903 - The last county was Houston County; 72% of its land area was carved from Henry. The balance came from Dale and Geneva counties.

After Houston County was formed in 1903, Henry County had become the smallest in geographic area.
This rural county was developed for agriculture, and planters held many slaves. After Reconstruction, conservative Democratic Party whites regained power in the state legislature and passed Jim Crow laws to suppress African Americans. They also used intimidation and violence to discourage voting, as the freedmen allied with the Republican Party, which they credited with achieving their emancipation and granting of the franchise.
From 1877 to 1950, whites lynched 13 African Americans in the county, most in the decades on either side of the turn of the 20th century.[5] Henry County is among the 805 counties where lynchings took place that is memorialized in the new National Memorial for Peace and Justice, which opened in April 2018 in Montgomery, Alabama.[6]
Mechanization and other changes resulted in population losses, especially from 1940 to 1970, as many African Americans left in the Great Migration, seeking to escape the oppression of Jim Crow and gain work in northern, midwestern and western industrial cities.
Geography[]
According to the U.S. Census Bureau, the county has a total area of 568 square miles (1,470 km2), of which 562 square miles (1,460 km2) is land and 6.6 square miles (17 km2) (1.2%) is water.[7] The county is located in the Wiregrass region of southeast Alabama.
It is the fourth-smallest county in Alabama by total area.
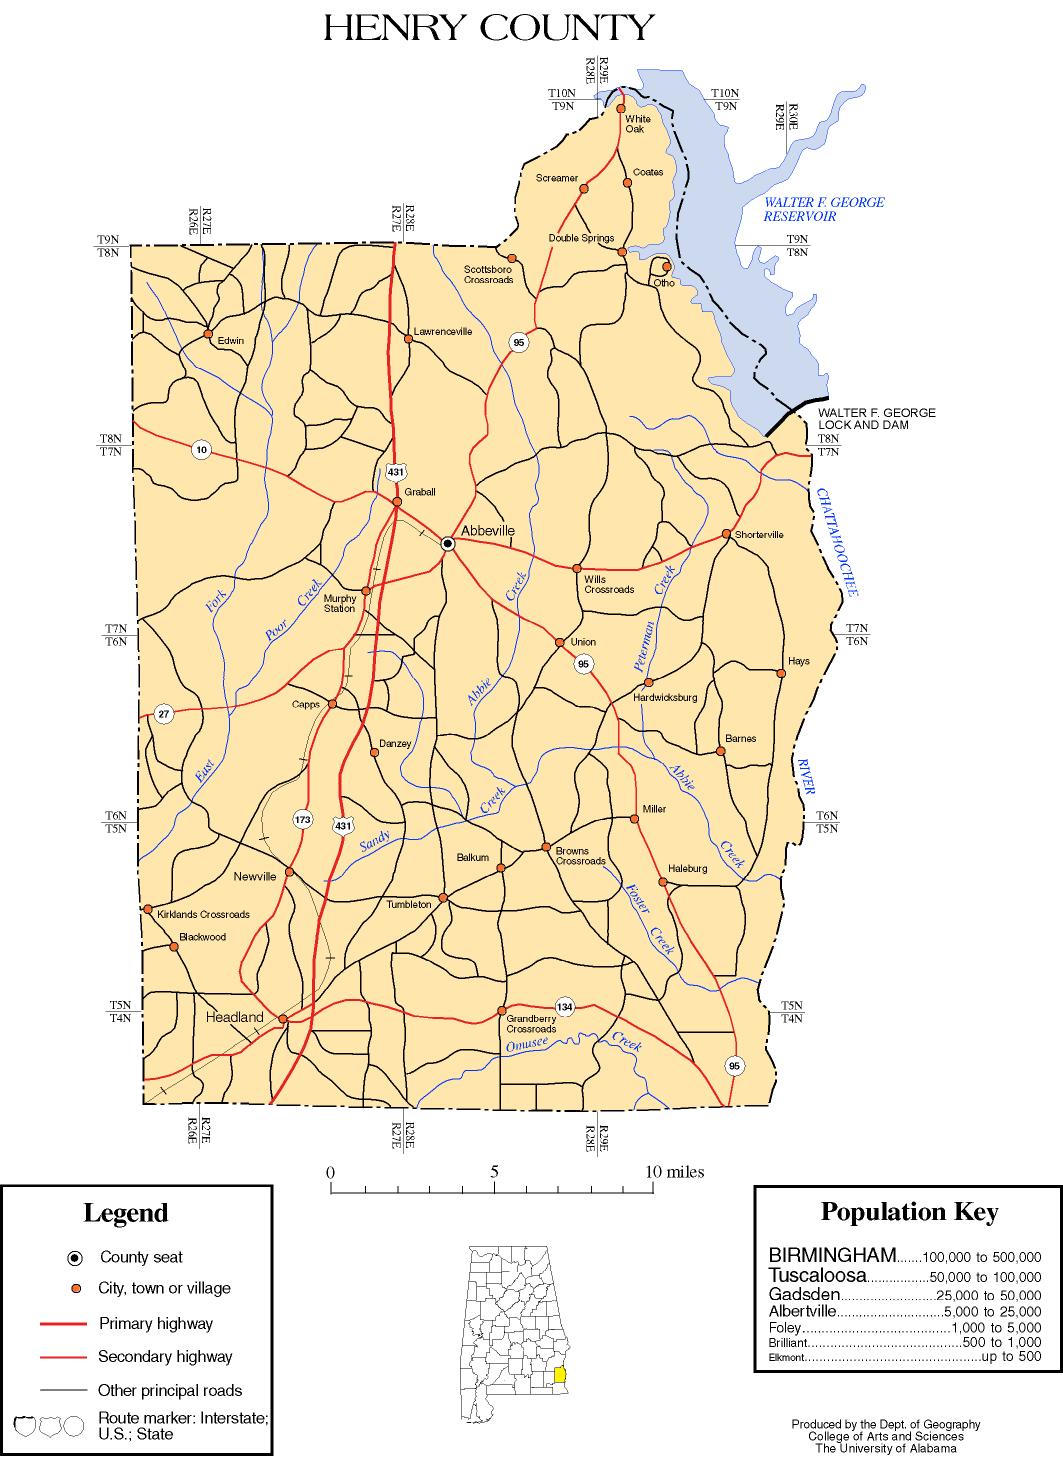
Major highways[]
 U.S. Highway 431
 State Route 10
 State Route 27
 State Route 95
 State Route 134
 State Route 173
Adjacent counties[]
- Barbour County (north)
- Clay County, Georgia (northeast/EST Border)
- Early County, Georgia (southeast/EST Border)
- Houston County (south)
- Dale County (west)
Demographics[]
| Historical population | |||
|---|---|---|---|
| Census | Pop. | %± | |
| 1820 | 2,638 | — | |
| 1830 | 4,020 | 52.4% | |
| 1840 | 5,787 | 44.0% | |
| 1850 | 9,019 | 55.8% | |
| 1860 | 14,918 | 65.4% | |
| 1870 | 14,191 | −4.9% | |
| 1880 | 18,761 | 32.2% | |
| 1890 | 24,847 | 32.4% | |
| 1900 | 36,147 | 45.5% | |
| 1910 | 20,943 | −42.1% | |
| 1920 | 21,547 | 2.9% | |
| 1930 | 22,820 | 5.9% | |
| 1940 | 21,912 | −4.0% | |
| 1950 | 18,674 | −14.8% | |
| 1960 | 15,286 | −18.1% | |
| 1970 | 13,254 | −13.3% | |
| 1980 | 15,302 | 15.5% | |
| 1990 | 15,374 | 0.5% | |
| 2000 | 16,310 | 6.1% | |
| 2010 | 17,302 | 6.1% | |
| 2020 | 17,146 | −0.9% | |
| U.S. Decennial Census[8] 1790–1960[9] 1900–1990[10] 1990–2000[11] 2010–2020[1] | |||
As of the census[12] of 2000, there were 16,310 people, 6,525 households, and 4,730 families living in the county. The population density was 29 people per square mile (11/km2). There were 8,037 housing units at an average density of 14 per square mile (6/km2). The racial makeup of the county was 65.67% White, 32.30% Black or African American, 0.21% Native American, 0.06% Asian, 0.02% Pacific Islander, 1.00% from other races, and 0.74% from two or more races. Nearly 1.53% of the population were Hispanic or Latino of any race.
Of the 6,525 households 30.50% had children under the age of 18 living with them, 53.90% were married couples living together, 14.70% had a female householder with no husband present, and 27.50% were non-families. Nearly 25.30% of households were made up of individuals, and 12.30% were one person aged 65 or older. The average household size was 2.47, and the average family size was 2.95.
The age distribution was 24.10% under the age of 18, 8.40% from 18 to 24, 25.70% from 25 to 44, 25.50% from 45 to 64, and 16.40% 65 or older. The median age was 39 years. For every 100 females, there were 90.60 males. For every 100 females age 18 and over, there were 86.20 males.
The median household income was $30,353 and the median family income was $36,555. Males had a median income of $29,189 versus $20,827 for females. The per capita income for the county was $15,681. About 14.50% of families and 19.10% of the population were below the poverty line, including 27.00% of those under age 18 and 20.60% of those age 65 or over.
2010 census[]
As of the census[13] of 2010, there were 17,302 people, 6,994 households, and 4,975 families living in the county. The population density was 31 people per square mile (11.8/km2). There were 8,891 housing units at an average density of 15.6 per square mile (6/km2). The racial makeup of the county was 68.6% White, 28.6% Black or African American, 0.3% Native American, 0.3% Asian, 0.0% Pacific Islander, 1.2% from other races, and 1.0% from two or more races. Nearly 2.2% of the population were Hispanic or Latino of any race.
Of the 6,994 households 25.9% had children under the age of 18 living with them, 51.9% were married couples living together, 14.6% had a female householder with no husband present, and 28.9% were non-families. Nearly 25.9% of households were made up of individuals, and 11.8% were one person aged 65 or older. The average household size was 2.45, and the average family size was 2.92.
The age distribution was 22.6% under the age of 18, 6.9% from 18 to 24, 23.1% from 25 to 44, 29.7% from 45 to 64, and 17.6% 65 or older. The median age was 42.8 years. For every 100 females, there were 92.2 males. For every 100 females age 18 and over, there were 93.1 males.
The median household income was $38,379 and the median family income was $46,976. Males had a median income of $37,276 versus $26,771 for females. The per capita income for the county was $19,716. About 15.0% of families and 15.1% of the population were below the poverty line, including 19.7% of those under age 18 and 15.4% of those age 65 or over.
Government[]
Henry County is a predominately Republican county. The last Democratic presidential candidate to carry the county was favorite son Jimmy Carter of Georgia in 1980. Bill Clinton came within 63 votes of carrying the county in 1996. The electorate has become more polarized in recent times, with Joe Biden winning less than thirty percent in 2020.
Rural conservative whites had left the Democratic Party following its support of civil rights laws and the movement in the 1960s; many disagreed with its socially liberal positions. Through the late 20th century, conservative whites shifted to the Republican Party. The political affiliations are strongly associated with ethnicity, as African Americans favor the Democratic Party but are a minority in the county.[14]
During the long period of African-American disenfranchisement in the 20th century, the conservative whites of Henry continued their well-established tradition of voting for Democratic candidates, and kept it as part of the "Solid South". They did vote for Republicans Warren G. Harding and Herbert Hoover in 1920 and 1928, respectively, giving them more than forty percent of the vote. In 1964, Barry Goldwater was the first Republican candidate to carry the county as whites began to shift their alliances.
In 1968, Henry County voted for the independent candidate, Alabama governor George Wallace, giving Republican Richard Nixon only 1.59 percent of the county's vote.[15]
Henry County elected Democrat Dexter Grimsley to represent it in the Alabama House of Representatives.
Communities[]
Cities[]
- Abbeville (county seat)
- Dothan (partly in Dale County and Houston County)
- Headland
Towns[]
Unincorporated communities[]
See also[]
- American Brass Superfund site
- National Register of Historic Places listings in Henry County, Alabama
- Properties on the Alabama Register of Landmarks and Heritage in Henry County, Alabama
References[]
- ^ Jump up to: a b "QuickFacts: Henry County, Alabama; Population, Census, 2020 & 2010". United States Census Bureau. Retrieved August 19, 2021.
- ^ "Find a County". National Association of Counties. Archived from the original on May 31, 2011. Retrieved June 7, 2011.
- ^ Gannett, Henry (1905). The Origin of Certain Place Names in the United States. Govt. Print. Off. pp. 155.
- ^ Scott, Marvin. "Mrs". Alabama Genealogy Web. Retrieved July 27, 2018.
- ^ Lynching in America/ Supplement: Lynchings by County, 3rd edition Archived October 23, 2017, at the Wayback Machine, Montgomery, Alabama: Equal Justice Initiative, 2015, p. 2
- ^ Oprah Winfrey, "Inside the memorial to victims of lynching", 60 Minutes, April 8, 2018; accessed April 11, 2018
- ^ "2010 Census Gazetteer Files". United States Census Bureau. August 22, 2012. Retrieved August 22, 2015.
- ^ "U.S. Decennial Census". United States Census Bureau. Retrieved August 22, 2015.
- ^ "Historical Census Browser". University of Virginia Library. Retrieved August 22, 2015.
- ^ Forstall, Richard L., ed. (March 24, 1995). "Population of Counties by Decennial Census: 1900 to 1990". United States Census Bureau. Retrieved August 22, 2015.
- ^ "Census 2000 PHC-T-4. Ranking Tables for Counties: 1990 and 2000" (PDF). United States Census Bureau. April 2, 2001. Retrieved August 22, 2015.
- ^ "U.S. Census website". United States Census Bureau. Retrieved May 14, 2011.
- ^ "U.S. Census website". United States Census Bureau. Retrieved July 24, 2015.
- ^ Cohn, Nate; ‘Demographic Shift: Southern Whites’ Loyalty to G.O.P. Nearing That of Blacks to Democrats’, New York Times, April 24, 2014
- ^ Dave Leip's U.S. Election Atlas; 1968 Presidential Election Statistics
- ^ "Dave Leip's Atlas of U.S. Presidential Elections". Retrieved November 16, 2016.
External links[]
- Henry County Historical Group
- History of Henry County, Alabama, hosted at Rootsweb.
- Henry County map of roads/towns (map 2007 Univ. of Alabama).
| show Places adjacent to Henry County, Alabama |
|---|
| show Municipalities and communities of Henry County, Alabama, United States |
|---|

| show Authority control |
|---|
Coordinates: 31°30′46″N 85°14′04″W / 31.51278°N 85.23444°W
- Alabama counties
- Henry County, Alabama
- Dothan metropolitan area, Alabama
- 1819 establishments in Alabama
- Populated places established in 1819