Labrador, Pangasinan
Labrador | |
|---|---|
| Municipality of Labrador | |
 Poblacion and Municipal Hall | |
 Seal | |
 Map of Pangasinan with Labrador highlighted | |
OpenStreetMap  | |
 Labrador Location within the Philippines | |
| Coordinates: 16°02′02″N 120°08′21″E / 16.03389°N 120.13917°ECoordinates: 16°02′02″N 120°08′21″E / 16.03389°N 120.13917°E | |
| Country | Philippines |
| Region | Ilocos Region |
| Province | Pangasinan |
| District | 2nd district |
| Founded | May 15, 1857 |
| Named for | San Isidro de Labrador |
| Barangays | 10 (see Barangays) |
| Government | |
| • Type | Sangguniang Bayan |
| • Mayor | Dominador V. Arenas |
| • Vice Mayor | Melchora A. Yaneza |
| • Representative | Jumel Anthony I. Espino |
| • Municipal Council | Members |
| • Electorate | 18,346 voters (2019) |
| Area | |
| • Total | 90.99 km2 (35.13 sq mi) |
| Elevation | 81 m (266 ft) |
| Highest elevation | 776 m (2,546 ft) |
| Lowest elevation | 0 m (0 ft) |
| Population (2020 census) [3] | |
| • Total | 26,811 |
| • Density | 290/km2 (760/sq mi) |
| • Households | 5,473 |
| Economy | |
| • Income class | 4th municipal income class |
| • Poverty incidence | 10.98% (2015)[4] |
| • Revenue | ₱110,704,899.43 (2020) |
| • Assets | ₱300,250,307.53 (2020) |
| • Expenditure | ₱90,782,201.35 (2020) |
| • Liabilities | ₱40,287,988.82 (2020) |
| Service provider | |
| • Electricity | Central Pangasinan Electric Cooperative (CENPELCO) |
| Time zone | UTC+8 (PST) |
| ZIP code | 2402 |
| PSGC | |
| IDD : area code | +63 (0)75 |
| Native languages | Pangasinan Ilocano Tagalog |

Labrador, officially the Municipality of Labrador (Pangasinan: Baley na Labrador; Ilocano: Ili ti Labrador; Tagalog: Bayan ng Labrador), is a 4th class municipality in the province of Pangasinan, Philippines. According to the 2020 census, it has a population of 26,811 people. [3]
Barangays[]
Labrador is politically subdivided into 10 barangays.
- Bolo (*Kadampat, *Quiray)
- Bongalon
- Dulig
- Laois
- Magsaysay
- Poblacion
- San Gonzalo
- San Jose
- Tobuan
- Uyong
Climate[]
| Climate data for Labrador, Pangasinan | |||||||||||||
|---|---|---|---|---|---|---|---|---|---|---|---|---|---|
| Month | Jan | Feb | Mar | Apr | May | Jun | Jul | Aug | Sep | Oct | Nov | Dec | Year |
| Average high °C (°F) | 31 (88) |
31 (88) |
31 (88) |
33 (91) |
32 (90) |
32 (90) |
30 (86) |
30 (86) |
30 (86) |
31 (88) |
31 (88) |
31 (88) |
31 (88) |
| Average low °C (°F) | 21 (70) |
21 (70) |
22 (72) |
24 (75) |
24 (75) |
24 (75) |
23 (73) |
23 (73) |
23 (73) |
23 (73) |
23 (73) |
22 (72) |
23 (73) |
| Average precipitation mm (inches) | 5.1 (0.20) |
11.6 (0.46) |
21.1 (0.83) |
27.7 (1.09) |
232.9 (9.17) |
350.8 (13.81) |
679.8 (26.76) |
733.1 (28.86) |
505 (19.9) |
176.6 (6.95) |
67.2 (2.65) |
17.7 (0.70) |
2,828.6 (111.38) |
| Average rainy days | 3 | 3 | 3 | 4 | 14 | 18 | 23 | 25 | 22 | 15 | 8 | 4 | 142 |
| Source: World Weather Online[5] | |||||||||||||
Demographics[]
| Year | Pop. | ±% p.a. |
|---|---|---|
| 1903 | 3,092 | — |
| 1918 | 3,920 | +1.59% |
| 1939 | 5,446 | +1.58% |
| 1948 | 6,967 | +2.77% |
| 1960 | 8,455 | +1.63% |
| 1970 | 10,835 | +2.51% |
| 1975 | 11,745 | +1.63% |
| 1980 | 12,120 | +0.63% |
| 1990 | 15,229 | +2.31% |
| 1995 | 16,706 | +1.75% |
| 2000 | 19,264 | +3.10% |
| 2007 | 20,508 | +0.87% |
| 2010 | 21,149 | +1.13% |
| 2015 | 23,201 | +1.78% |
| 2020 | 26,811 | +2.88% |
| Source: Philippine Statistics Authority [6] [7] [8][9] | ||
Economy[]
| Poverty Incidence of Labrador | |
| Source: Philippine Statistics Authority[10][11][12][13][14][15] | |
Images[]
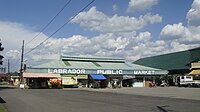
Public Market
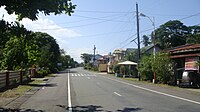
Highway and downtown

St. Isidore the Farmer Parish Church (Poblacion)
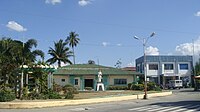
Police Station & Municipal Hospital (Poblacion)
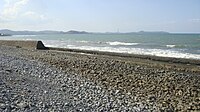
Laois beaches along coastal shores of Lingayen Gulf

Uyong river, beaches and shores


References[]
- ^ Municipality of Labrador | (DILG)
- ^ "2015 Census of Population, Report No. 3 – Population, Land Area, and Population Density" (PDF). Philippine Statistics Authority. Quezon City, Philippines. August 2016. ISSN 0117-1453. Archived (PDF) from the original on May 25, 2021. Retrieved July 16, 2021.
- ^ a b Census of Population (2020). "Region I (Ilocos Region)". Total Population by Province, City, Municipality and Barangay. PSA. Retrieved 8 July 2021.
- ^ https://psa.gov.ph/sites/default/files/City%20and%20Municipal-level%20Small%20Area%20Poverty%20Estimates_%202009%2C%202012%20and%202015_0.xlsx; publication date: 10 July 2019; publisher: Philippine Statistics Authority.
- ^ "Labrador, Pangasinan: Average Temperatures and Rainfall". World Weather Online. Retrieved 12 October 2015.
- ^ Census of Population (2015). "Region I (Ilocos Region)". Total Population by Province, City, Municipality and Barangay. PSA. Retrieved 20 June 2016.
- ^ Census of Population and Housing (2010). "Region I (Ilocos Region)". Total Population by Province, City, Municipality and Barangay. NSO. Retrieved 29 June 2016.
- ^ Censuses of Population (1903–2007). "Region I (Ilocos Region)". Table 1. Population Enumerated in Various Censuses by Province/Highly Urbanized City: 1903 to 2007. NSO.
- ^ "Province of Pangasinan". Municipality Population Data. Local Water Utilities Administration Research Division. Retrieved 17 December 2016.
- ^ "Poverty incidence (PI):". Philippine Statistics Authority. Retrieved 28 December 2020.
- ^ https://psa.gov.ph/sites/default/files/NSCB_LocalPovertyPhilippines_0.pdf; publication date: 29 November 2005; publisher: Philippine Statistics Authority.
- ^ https://psa.gov.ph/sites/default/files/2003%20SAE%20of%20poverty%20%28Full%20Report%29_1.pdf; publication date: 23 March 2009; publisher: Philippine Statistics Authority.
- ^ https://psa.gov.ph/sites/default/files/2006%20and%202009%20City%20and%20Municipal%20Level%20Poverty%20Estimates_0_1.pdf; publication date: 3 August 2012; publisher: Philippine Statistics Authority.
- ^ https://psa.gov.ph/sites/default/files/2012%20Municipal%20and%20City%20Level%20Poverty%20Estima7tes%20Publication%20%281%29.pdf; publication date: 31 May 2016; publisher: Philippine Statistics Authority.
- ^ https://psa.gov.ph/sites/default/files/City%20and%20Municipal-level%20Small%20Area%20Poverty%20Estimates_%202009%2C%202012%20and%202015_0.xlsx; publication date: 10 July 2019; publisher: Philippine Statistics Authority.
External links[]
| Wikimedia Commons has media related to Labrador, Pangasinan. |
- Labrador Profile at PhilAtlas.com
- Municipal Profile at the National Competitiveness Council of the Philippines
- Labrador at the Pangasinan Government Website
- Local Governance Performance Management System
- Philippine Standard Geographic Code
- Philippine Census Information
Places adjacent to Labrador, Pangasinan | ||||||||||||||||
|---|---|---|---|---|---|---|---|---|---|---|---|---|---|---|---|---|
| ||||||||||||||||
Lingayen (capital) | |
| Municipalities |
|
| Component cities | |
| Independent component city |
|
| Barangays | |
This article about a location in Ilocos region is a stub. You can help Wikipedia by . |
Categories:
- Municipalities of Pangasinan
- Philippines geography stubs