San Quintin, Pangasinan
San Quintin | |
|---|---|
| Municipality of San Quintin | |
 | |
 Seal | |
 Map of Pangasinan with San Quintin highlighted | |
show OpenStreetMap | |
 San Quintin Location within the Philippines | |
| Coordinates: 15°59′04″N 120°48′54″E / 15.98444°N 120.815°ECoordinates: 15°59′04″N 120°48′54″E / 15.98444°N 120.815°E | |
| Country | Philippines |
| Region | Ilocos Region |
| Province | Pangasinan |
| District | 6th district |
| Founded | June 5, 1863 |
| Named for | Saint Quentin |
| Barangays | 21 (see Barangays) |
| Government | |
| • Type | Sangguniang Bayan |
| • Mayor | Clark Cecil P. Tiu |
| • Vice Mayor | Gerry C. Abenojar |
| • Representative | Tyrone D. Agabas |
| • Municipal Council | show
Members |
| • Electorate | 23,224 voters (2019) |
| Area | |
| • Total | 115.90 km2 (44.75 sq mi) |
| Elevation | 146 m (479 ft) |
| Highest elevation | 1,172 m (3,845 ft) |
| Lowest elevation | 61 m (200 ft) |
| Population (2020 census) [3] | |
| • Total | 33,980 |
| • Density | 290/km2 (760/sq mi) |
| • Households | 8,002 |
| Economy | |
| • Income class | 3rd municipal income class |
| • Poverty incidence | 12.64% (2015)[4] |
| • Revenue | ₱94,034,287.75 (2016) |
| Service provider | |
| • Electricity | Pangasinan 3 Electric Cooperative (PANELCO 3) |
| Time zone | UTC+8 (PST) |
| ZIP code | 2444 |
| PSGC | |
| IDD : area code | +63 (0)75 |
| Climate type | tropical monsoon climate |
| Native languages | Pangasinan Ilocano Tagalog |
| Website | sanquintinpangasinan |


San Quintin, officially the Municipality of San Quintin (Pangasinan: Baley na San Quintin; Ilocano: Ili ti San Quintin; Tagalog: Bayan ng San Quintin), is a 3rd class municipality in the province of Pangasinan, Philippines. According to the 2020 census, it has a population of 33,980 people. [3]
Barangays[]
San Quintin is politically subdivided into 21 barangays.
- Alac
- Baligayan
- Bantog
- Bolintaguen
- Cabangaran
- Cabalaoangan
- Calomboyan
- Carayacan
- Casantamaria-an
- Gonzalo
- Labuan
- Lagasit
- Lumayao
- Mabini
- Mantacdang
- Nangapugan
- San Pedro
- Ungib
- Poblacion Zone I
- Poblacion Zone II
- Poblacion Zone III
Climate[]
| hideClimate data for San Quintin, Pangasinan | |||||||||||||
|---|---|---|---|---|---|---|---|---|---|---|---|---|---|
| Month | Jan | Feb | Mar | Apr | May | Jun | Jul | Aug | Sep | Oct | Nov | Dec | Year |
| Average high °C (°F) | 31 (88) |
31 (88) |
32 (90) |
34 (93) |
35 (95) |
34 (93) |
32 (90) |
32 (90) |
32 (90) |
32 (90) |
32 (90) |
31 (88) |
32 (90) |
| Average low °C (°F) | 22 (72) |
22 (72) |
22 (72) |
24 (75) |
24 (75) |
24 (75) |
24 (75) |
24 (75) |
24 (75) |
23 (73) |
23 (73) |
22 (72) |
23 (74) |
| Average precipitation mm (inches) | 13.6 (0.54) |
10.4 (0.41) |
18.2 (0.72) |
15.7 (0.62) |
178.4 (7.02) |
227.9 (8.97) |
368 (14.5) |
306.6 (12.07) |
310.6 (12.23) |
215.7 (8.49) |
70.3 (2.77) |
31.1 (1.22) |
1,766.5 (69.56) |
| Average rainy days | 3 | 2 | 2 | 4 | 14 | 16 | 23 | 21 | 24 | 15 | 10 | 6 | 140 |
| Source: World Weather Online[5] | |||||||||||||
Demographics[]

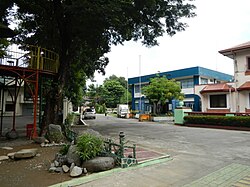
San Quintin Town Hall
| Year | Pop. | ±% p.a. |
|---|---|---|
| 1903 | 8,092 | — |
| 1918 | 9,762 | +1.26% |
| 1939 | 12,833 | +1.31% |
| 1948 | 15,330 | +2.00% |
| 1960 | 16,444 | +0.59% |
| 1970 | 18,842 | +1.37% |
| 1975 | 20,381 | +1.59% |
| 1980 | 20,835 | +0.44% |
| 1990 | 24,293 | +1.55% |
| 1995 | 26,257 | +1.47% |
| 2000 | 28,258 | +1.59% |
| 2007 | 30,556 | +1.08% |
| 2010 | 32,626 | +2.41% |
| 2015 | 32,945 | +0.19% |
| 2020 | 33,980 | +0.61% |
| Source: Philippine Statistics Authority [6] [7] [8][9] | ||
Economy[]
| Poverty Incidence of San Quintin | |
| Source: Philippine Statistics Authority[10][11][12][13][14][15] | |
References[]
- ^ Municipality of San Quintin | (DILG)
- ^ "2015 Census of Population, Report No. 3 – Population, Land Area, and Population Density" (PDF). Philippine Statistics Authority. Quezon City, Philippines. August 2016. ISSN 0117-1453. Archived (PDF) from the original on May 25, 2021. Retrieved July 16, 2021.
- ^ Jump up to: a b Census of Population (2020). "Region I (Ilocos Region)". Total Population by Province, City, Municipality and Barangay. PSA. Retrieved 8 July 2021.
- ^ https://psa.gov.ph/sites/default/files/City%20and%20Municipal-level%20Small%20Area%20Poverty%20Estimates_%202009%2C%202012%20and%202015_0.xlsx; publication date: 10 July 2019; publisher: Philippine Statistics Authority.
- ^ "San Quintin, Pangasinan: Average Temperatures and Rainfall". World Weather Online. Retrieved 31 October 2015.
- ^ Census of Population (2015). "Region I (Ilocos Region)". Total Population by Province, City, Municipality and Barangay. PSA. Retrieved 20 June 2016.
- ^ Census of Population and Housing (2010). "Region I (Ilocos Region)". Total Population by Province, City, Municipality and Barangay. NSO. Retrieved 29 June 2016.
- ^ Censuses of Population (1903–2007). "Region I (Ilocos Region)". Table 1. Population Enumerated in Various Censuses by Province/Highly Urbanized City: 1903 to 2007. NSO.
- ^ "Province of Pangasinan". Municipality Population Data. Local Water Utilities Administration Research Division. Retrieved 17 December 2016.
- ^ "Poverty incidence (PI):". Philippine Statistics Authority. Retrieved 28 December 2020.
- ^ https://psa.gov.ph/sites/default/files/NSCB_LocalPovertyPhilippines_0.pdf; publication date: 29 November 2005; publisher: Philippine Statistics Authority.
- ^ https://psa.gov.ph/sites/default/files/2003%20SAE%20of%20poverty%20%28Full%20Report%29_1.pdf; publication date: 23 March 2009; publisher: Philippine Statistics Authority.
- ^ https://psa.gov.ph/sites/default/files/2006%20and%202009%20City%20and%20Municipal%20Level%20Poverty%20Estimates_0_1.pdf; publication date: 3 August 2012; publisher: Philippine Statistics Authority.
- ^ https://psa.gov.ph/sites/default/files/2012%20Municipal%20and%20City%20Level%20Poverty%20Estima7tes%20Publication%20%281%29.pdf; publication date: 31 May 2016; publisher: Philippine Statistics Authority.
- ^ https://psa.gov.ph/sites/default/files/City%20and%20Municipal-level%20Small%20Area%20Poverty%20Estimates_%202009%2C%202012%20and%202015_0.xlsx; publication date: 10 July 2019; publisher: Philippine Statistics Authority.
External links[]
| Wikimedia Commons has media related to San Quintin, Pangasinan. |
- San Quintin Profile at PhilAtlas.com
- Municipal Profile at the National Competitiveness Council of the Philippines
- San Quintin at the Pangasinan Government Website
- Local Governance Performance Management System
- Philippine Standard Geographic Code
- Philippine Census Information
| show Places adjacent to San Quintin, Pangasinan |
|---|
| show |
|---|
| Authority control |
|---|
This article about a location in Ilocos region is a stub. You can help Wikipedia by . |
Categories:
- Municipalities of Pangasinan
- Philippines geography stubs