Natividad, Pangasinan
Natividad | |
|---|---|
| Municipality of Natividad | |
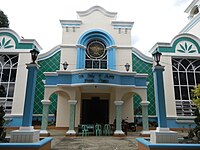
 Municipal hall | |
 Seal | |
 Map of Pangasinan with Natividad highlighted | |
OpenStreetMap  | |
 Natividad Location within the Philippines | |
| Coordinates: 16°03′N 120°49′E / 16.05°N 120.82°ECoordinates: 16°03′N 120°49′E / 16.05°N 120.82°E | |
| Country | Philippines |
| Region | Ilocos Region |
| Province | Pangasinan |
| District | 6th district |
| Barangays | 18 (see Barangays) |
| Government | |
| • Type | Sangguniang Bayan |
| • Mayor | Rosita G. Rafael |
| • Vice Mayor | Jefferson Keith C. de Guzman |
| • Representative | Tyrone D. Agabas |
| • Municipal Council | Members |
| • Electorate | 16,954 voters (2019) |
| Area | |
| • Total | 134.36 km2 (51.88 sq mi) |
| Elevation | 135 m (443 ft) |
| Highest elevation | 981 m (3,219 ft) |
| Lowest elevation | 60 m (200 ft) |
| Population (2020 census) [3] | |
| • Total | 25,771 |
| • Density | 190/km2 (500/sq mi) |
| • Households | 5,690 |
| Economy | |
| • Income class | 4th municipal income class |
| • Poverty incidence | 11.72% (2015)[4] |
| • Revenue | ₱116,024,034.73 (2020) |
| • Assets | ₱323,845,532.41 (2020) |
| • Expenditure | ₱86,114,522.19 (2020) |
| • Liabilities | ₱22,820,595.65 (2020) |
| Service provider | |
| • Electricity | Pangasinan 3 Electric Cooperative (PANELCO 3) |
| Time zone | UTC+8 (PST) |
| ZIP code | 2446 |
| PSGC | |
| IDD : area code | +63 (0)75 |
| Native languages | Pangasinan Ilocano Tagalog |
| Website | www |

Natividad, officially the Municipality of Natividad (Pangasinan: Baley na Natividad; Ilocano: Ili ti Natividad; Tagalog: Bayan ng Natividad), is a 4th class municipality in the province of Pangasinan, Philippines. According to the 2020 census, it has a population of 25,771 people. [3]
Barangays
Natividad is politically subdivided into 18 barangays.
- Barangobong
- Batchelor East
- Batchelor West
- Burgos (San Narciso)
- Cacandungan
- Calapugan
- Canarem
- Luna
- Poblacion East
- Poblacion West
- Rizal
- Salud
- San Eugenio
- San Macario Norte
- San Macario Sur
- San Maximo
- San Miguel
- Silag
Climate
| Climate data for Natividad, Pangasinan | |||||||||||||
|---|---|---|---|---|---|---|---|---|---|---|---|---|---|
| Month | Jan | Feb | Mar | Apr | May | Jun | Jul | Aug | Sep | Oct | Nov | Dec | Year |
| Average high °C (°F) | 31 (88) |
31 (88) |
32 (90) |
34 (93) |
35 (95) |
34 (93) |
32 (90) |
32 (90) |
32 (90) |
32 (90) |
32 (90) |
31 (88) |
32 (90) |
| Average low °C (°F) | 22 (72) |
22 (72) |
22 (72) |
24 (75) |
24 (75) |
24 (75) |
24 (75) |
24 (75) |
24 (75) |
23 (73) |
23 (73) |
22 (72) |
23 (74) |
| Average precipitation mm (inches) | 13.6 (0.54) |
10.4 (0.41) |
18.2 (0.72) |
15.7 (0.62) |
178.4 (7.02) |
227.9 (8.97) |
368 (14.5) |
306.6 (12.07) |
310.6 (12.23) |
215.7 (8.49) |
70.3 (2.77) |
31.1 (1.22) |
1,766.5 (69.56) |
| Average rainy days | 3 | 2 | 2 | 4 | 14 | 16 | 23 | 21 | 24 | 15 | 10 | 6 | 140 |
| Source: World Weather Online[5] | |||||||||||||
Demographics
| Year | Pop. | ±% p.a. |
|---|---|---|
| 1903 | 7,453 | — |
| 1918 | 9,347 | +1.52% |
| 1939 | 9,946 | +0.30% |
| 1948 | 11,780 | +1.90% |
| 1960 | 10,490 | −0.96% |
| 1970 | 13,592 | +2.62% |
| 1975 | 14,416 | +1.19% |
| 1980 | 15,246 | +1.13% |
| 1990 | 17,010 | +1.10% |
| 1995 | 18,070 | +1.14% |
| 2000 | 19,870 | +2.06% |
| 2007 | 21,560 | +1.13% |
| 2010 | 22,713 | +1.91% |
| 2015 | 24,299 | +1.29% |
| 2020 | 25,771 | +1.16% |
| Source: Philippine Statistics Authority [6] [7] [8][9] | ||
Economy
| Poverty Incidence of Natividad | |
| Source: Philippine Statistics Authority[10][11][12][13][14][15] | |
Gallery

Town Plaza
Our Lady of the Nativity Parish Church of Natividad


References
- ^ Municipality of Natividad | (DILG)
- ^ "2015 Census of Population, Report No. 3 – Population, Land Area, and Population Density" (PDF). Philippine Statistics Authority. Quezon City, Philippines. August 2016. ISSN 0117-1453. Archived (PDF) from the original on May 25, 2021. Retrieved July 16, 2021.
- ^ a b Census of Population (2020). "Region I (Ilocos Region)". Total Population by Province, City, Municipality and Barangay. PSA. Retrieved 8 July 2021.
- ^ https://psa.gov.ph/sites/default/files/City%20and%20Municipal-level%20Small%20Area%20Poverty%20Estimates_%202009%2C%202012%20and%202015_0.xlsx; publication date: 10 July 2019; publisher: Philippine Statistics Authority.
- ^ "Natividad, Pangasinan: Average Temperatures and Rainfall". World Weather Online. Retrieved 12 October 2015.
- ^ Census of Population (2015). "Region I (Ilocos Region)". Total Population by Province, City, Municipality and Barangay. PSA. Retrieved 20 June 2016.
- ^ Census of Population and Housing (2010). "Region I (Ilocos Region)". Total Population by Province, City, Municipality and Barangay. NSO. Retrieved 29 June 2016.
- ^ Censuses of Population (1903–2007). "Region I (Ilocos Region)". Table 1. Population Enumerated in Various Censuses by Province/Highly Urbanized City: 1903 to 2007. NSO.
- ^ "Province of Pangasinan". Municipality Population Data. Local Water Utilities Administration Research Division. Retrieved 17 December 2016.
- ^ "Poverty incidence (PI):". Philippine Statistics Authority. Retrieved 28 December 2020.
- ^ https://psa.gov.ph/sites/default/files/NSCB_LocalPovertyPhilippines_0.pdf; publication date: 29 November 2005; publisher: Philippine Statistics Authority.
- ^ https://psa.gov.ph/sites/default/files/2003%20SAE%20of%20poverty%20%28Full%20Report%29_1.pdf; publication date: 23 March 2009; publisher: Philippine Statistics Authority.
- ^ https://psa.gov.ph/sites/default/files/2006%20and%202009%20City%20and%20Municipal%20Level%20Poverty%20Estimates_0_1.pdf; publication date: 3 August 2012; publisher: Philippine Statistics Authority.
- ^ https://psa.gov.ph/sites/default/files/2012%20Municipal%20and%20City%20Level%20Poverty%20Estima7tes%20Publication%20%281%29.pdf; publication date: 31 May 2016; publisher: Philippine Statistics Authority.
- ^ https://psa.gov.ph/sites/default/files/City%20and%20Municipal-level%20Small%20Area%20Poverty%20Estimates_%202009%2C%202012%20and%202015_0.xlsx; publication date: 10 July 2019; publisher: Philippine Statistics Authority.
External links
| Wikimedia Commons has media related to Natividad, Pangasinan. |
- Natividad Profile at PhilAtlas.com
- Municipal Profile at the National Competitiveness Council of the Philippines
- Natividad at the Pangasinan Government Website
- Local Governance Performance Management System
- Philippine Standard Geographic Code
- Philippine Census Information
Places adjacent to Natividad, Pangasinan | ||||||||||||||||
|---|---|---|---|---|---|---|---|---|---|---|---|---|---|---|---|---|
| ||||||||||||||||
Lingayen (capital) | |
| Municipalities |
|
| Component cities | |
| Independent component city |
|
| Barangays | |
This article about a location in Ilocos region is a stub. You can help Wikipedia by . |
Categories:
- Municipalities of Pangasinan
- Philippines geography stubs