List of municipalities in New Brunswick
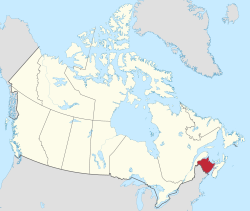

New Brunswick is the eighth-most populous province in Canada with 775,610 residents as of the 2021 Census, and the third-smallest province in land area at 71,248.50 km2 (27,509.20 sq mi).[1] New Brunswick's 104 municipalities[2] cover only 10.9% of the province's land mass but are home to 69.5% of its population.
Municipalities in New Brunswick may incorporate under the Municipalities Act of 1973 as a city, town, village, regional municipality, or rural community.[3] Municipal governments are led by elected councils and are responsible for the delivery of services such as civic administration, land use planning, emergency measures, policing, road, and garbage collection.[4] New Brunswick has 8 cities, 26 towns, 61 villages, 1 regional municipality, and 8 rural communities.[4][5] Although rural communities are under the Municipalities Act, the provincial government distinguishes them from municipalities.[6]
In 1785, Saint John became the first community in what would eventually become Canada to incorporate as a city.[7] Moncton is New Brunswick's largest municipality by population with 79,470 residents and Saint John is the largest urban municipality by land area at 315.59 km2 (121.85 sq mi).[8] Approximately one-third of the residents of New Brunswick do not live in municipalities but reside in local service districts, which are unincorporated communities administered by the Minister of Environment and Local Government and have no local government of their own.[4]
Cities[]
The Lieutenant-Governor in Council may incorporate an area as a city under the Local Governance Act if it has a population of at least 10,000.[3] Cities already in existence on January 1, 1967 continue to be incorporated regardless of population.[3] New Brunswick had eight cities that had a cumulative population of 293,928 in the 2021 Census.[8] Moncton is New Brunswick's largest city by population with 79,470 residents and Saint John is the largest by land area 315.59 km2 (121.85 sq mi) respectively.[8] Campbellton is New Brunswick's smallest city by population and land area with 7,047 residents and 18.57 km2 (7.17 sq mi).[8]
Towns[]
The Lieutenant-Governor in Council may incorporate an area as a town under the Local Governance Act if it has a population of at least 1,500 and provides a level of services that the Minister of Local Government and Local Governance Reform considers appropriate.[3] Towns already in existence on January 1, 1967 continue to be incorporated regardless of population.[3] New Brunswick had 26 towns that had a cumulative population of 133,350 in the 2021 Census.[8] New Brunswick's largest town by population is Riverview with 20,584 residents and largest town by area is Sackville with a land area of 73.91 km2 (28.54 sq mi).[8] New Brunswick's smallest town by population is Hartland with 933 residents and the smallest by land area is Saint-Quentin at 4.24 km2 (1.64 sq mi).[8]
Villages[]
New Brunswick's 61 villages had a cumulative population of 71,186 as of the 2021 Census.[8] New Brunswick's largest village by population is Memramcook with 5,029 residents and largest village by area is Belledune with a land area of 189.18 km2 (73.04 sq mi).[8] New Brunswick's smallest village by population is Meductic with 180 residents and the smallest by land area is at 1.98 km2 (0.76 sq mi).[8]
Regional municipalities[]
The Lieutenant-Governor in Council may incorporate an area as a Regional Municipality under the Local Governance Act if there is a population of at least 15,000 and at leas one existing municipality. New Brunswick's first and only regional municipality was incorporated on May 12, 2014.[9] The Regional Municipality of Tracadie was formed through the amalgamation of the former Town of Tracadie–Sheila, eighteen local service districts and portions of two other local service districts.[9] Regional municipalities must have a population greater than 15,000 and a community grouping that includes at least one municipality.[4] Regional municipalities elect a local council but are responsible only for community administration, planning and emergency measures services, and all services previously provided by any former municipality that is now part of the regional municipality.[4] The Province of New Brunswick is responsible for police protection and road services, unless the regional municipality chooses to assume these responsibilities.[4]
Rural communities[]
New Brunswick eight rural communities, an increase from four as of the 2011 census following the incorporations of Kedgwick in 2012, Cocagne and Hanwell in 2014, and Haut-Madawaska in 2017.[13] Haut-Madawaska was formed in 2017 through the amalgamation of four villages (Baker Brook, Clair, Saint-François de Madawaska and Saint-Hilaire) with five local service districts (the parishes of Baker Brook, Clair, Lac Baker, Saint-François, and Saint-Hilaire) and a portion of a sixth local service district (the parish of Madawaska)[14] These eight rural communities had a cumulative population of 24,842 in the 2021 Census.[8] New Brunswick's largest and smallest rural communities are Beaubassin East and Campobello Island with populations of 6,718 and 949 respectively.[8] Rural communities elect local councils and are responsible for the delivery of some local services, including administrative services, community planning and emergency measures.[4] The province of New Brunswick ensures the delivery of other services including solid waste collection and recreation services unless the rural community chooses to take on these responsibilities.[4] Rural communities that include a former village or town are an exception, as they are responsible to provide all services that were previously provided by their former municipality.[4]
List of municipalities[]

Skyline of Moncton, New Brunswick's largest municipality

Skyline of Saint John, New Brunswick's second largest municipality

Skyline of Fredericton, New Brunswick's capital city and third-largest municipality


| Name | Municipal type | County[15] | Incorporation date[16] |
2021 Census of Population[15] | ||||
|---|---|---|---|---|---|---|---|---|
| Population (2021) |
Population (2016) |
Change |
Land area (km²) |
Population density | ||||
| Bathurst | City | Gloucester | 1912 | 12,157 | 11,897 | +2.2% | 91.62 | 132.7/km2 |
| Campbellton | City | Restigouche | 1888 | 7,047 | 6,883 | +2.4% | 18.57 | 379.5/km2 |
| Dieppe | City | Westmorland | 1952 | 28,114 | 25,384 | +10.8% | 77.02 | 365.0/km2 |
| Edmundston | City | Madawaska | 1952 | 16,437 | 16,580 | −0.9% | 106.84 | 153.8/km2 |
| Fredericton | City | York | 1848 | 63,116 | 58,721 | +7.5% | 133.93 | 471.3/km2 |
| Miramichi | City | Northumberland | 1995 | 17,692 | 17,537 | +0.9% | 178.98 | 98.8/km2 |
| Moncton | City | Westmorland | 1890 | 79,470 | 71,889 | +10.5% | 140.67 | 564.9/km2 |
| Saint John | City | Saint John | 1785 | 69,895 | 67,575 | +3.4% | 315.59 | 221.5/km2 |
| Tracadie | Regional municipality | Gloucester | 2014[17] | 16,043 | 16,114 | −0.4% | 516.55 | 31.1/km2 |
| Beaubassin East | Rural community | Westmorland | 1995[18] | 6,718 | 6,376 | +5.4% | 291.02 | 23.1/km2 |
| Campobello Island | Rural community | Charlotte | 2010[19] | 949 | 872 | +8.8% | 39.59 | 24.0/km2 |
| Cocagne | Rural community | Kent | 2014[11] | 2,757 | 2,649 | +4.1% | 69.23 | 39.8/km2 |
| Hanwell | Rural community | York | 2014[12] | 4,743 | 4,700 | +0.9% | 152.06 | 31.2/km2 |
| Haut-Madawaska | Rural Community | Madawaska | 2017[14] | 3,720 | 3,714 | +0.2% | 611.55 | 6.1/km2 |
| Kedgwick | Rural community | Restigouche | 2012[10] | 1,986 | 1,964 | +1.1% | 649.36 | 3.1/km2 |
| Saint-André | Rural community | Madawaska | 2006[20] | 1,794 | 1,901 | −5.6% | 136.19 | 13.2/km2 |
| Upper Miramichi | Rural community | Northumberland | 2008[21] | 2,175 | 2,218 | −1.9% | 1,832.97 | 1.2/km2 |
| Beresford | Town | Gloucester | 1967 | 4,294 | 4,288 | +0.1% | 19.24 | 223.2/km2 |
| Bouctouche | Town | Kent | 1966 | 2,513 | 2,361 | +6.4% | 18.33 | 137.1/km2 |
| Caraquet | Town | Gloucester | 1961 | 4,285 | 4,248 | +0.9% | 68.13 | 62.9/km2 |
| Dalhousie | Town | Restigouche | 1905 | 3,223 | 3,126 | +3.1% | 15.12 | 213.2/km2 |
| Florenceville-Bristol | Town | Carleton | 2008 | 1,573 | 1,604 | −1.9% | 15.74 | 99.9/km2 |
| Grand Bay-Westfield | Town | Kings | 1998 | 4,967 | 4,964 | +0.1% | 59.82 | 83.0/km2 |
| Grand Falls | Town | Victoria | 1890 | 5,220 | 5,326 | −2.0% | 18.04 | 289.4/km2 |
| Hampton | Town | Kings | 1966 | 4,395 | 4,289 | +2.5% | 20.97 | 209.6/km2 |
| Hartland | Town | Carleton | 1918 | 933 | 957 | −2.5% | 9.50 | 98.2/km2 |
| Lamèque | Town | Gloucester | 1966 | 1,301 | 1,285 | +1.2% | 12.40 | 104.9/km2 |
| Nackawic | Town | York | 1976 | 962 | 941 | +2.2% | 7.68 | 125.3/km2 |
| Oromocto | Town | Sunbury | 1956 | 9,045 | 9,223 | −1.9% | 22.36 | 404.5/km2 |
| Quispamsis | Town | Kings | 1966 | 18,768 | 18,245 | +2.9% | 56.97 | 329.4/km2 |
| Richibucto | Town | Kent | 1966 | 1,411 | 1,266 | +11.5% | 11.90 | 118.6/km2 |
| Riverview | Town | Albert | 1973 | 20,584 | 19,667 | +4.7% | 34.10 | 603.6/km2 |
| Rothesay | Town | Kings | 1988 | 11,977 | 11,659 | +2.7% | 34.59 | 346.3/km2 |
| Sackville | Town | Westmorland | 1903 | 6,099 | 5,331 | +14.4% | 73.91 | 82.5/km2 |
| Saint Andrews | Town | Charlotte | 1903 | 2,048 | 1,786 | +14.7% | 8.35 | 245.3/km2 |
| Saint-Léonard | Town | Madawaska | 1920 | 1,322 | 1,300 | +1.7% | 5.34 | 247.6/km2 |
| Saint-Quentin | Town | Restigouche | 1947 | 2,141 | 2,194 | −2.4% | 4.24 | 505.0/km2 |
| Shediac | Town | Westmorland | 1903 | 7,535 | 6,664 | +13.1% | 64.00 | 117.7/km2 |
| Shippagan | Town | Gloucester | 1947 | 2,672 | 2,580 | +3.6% | 9.96 | 268.3/km2 |
| St. George | Town | Charlotte | 1904 | 1,579 | 1,517 | +4.1% | 16.17 | 97.6/km2 |
| St. Stephen | Town | Charlotte | 1973[a] | 4,510 | 4,415 | +2.2% | 13.72 | 328.7/km2 |
| Sussex | Town | Kings | 1904 | 4,440 | 4,282 | +3.7% | 8.90 | 498.9/km2 |
| Woodstock | Town | Carleton | 1856 | 5,553 | 5,228 | +6.2% | 14.96 | 371.2/km2 |
| Alma | Village | Albert | 1966 | 282 | 213 | +32.4% | 47.64 | 5.9/km2 |
| Aroostook | Village | Victoria | 1966 | 313 | 306 | +2.3% | 2.23 | 140.4/km2 |
| Atholville | Village | Restigouche | 1966 | 3,290 | 3,570 | −7.8% | 119.58 | 27.5/km2 |
| Balmoral | Village | Restigouche | 1972 | 1,603 | 1,674 | −4.2% | 43.33 | 37.0/km2 |
| Bas-Caraquet | Village | Gloucester | 1966 | 1,311 | 1,305 | +0.5% | 30.93 | 42.4/km2 |
| Bath | Village | Carleton | 1966 | 440 | 476 | −7.6% | 2.00 | 220.0/km2 |
| Belledune | Village | Restigouche | 1968 | 1,325 | 1,417 | −6.5% | 189.18 | 7.0/km2 |
| Bertrand | Village | Gloucester | 1968 | 1,153 | 1,166 | −1.1% | 57.01 | 20.2/km2 |
| Blacks Harbour | Village | Charlotte | 1972 | 907 | 894 | +1.5% | 9.02 | 100.6/km2 |
| Blackville | Village | Northumberland | 1966 | 914 | 958 | −4.6% | 20.97 | 43.6/km2 |
| Cambridge-Narrows | Village | Queens | 1966 | 715 | 562 | +27.2% | 106.79 | 6.7/km2 |
| Canterbury | Village | York | 1966 | 320 | 336 | −4.8% | 5.32 | 60.2/km2 |
| Cap-Pelé | Village | Westmorland | 1969 | 2,441 | 2,425 | +0.7% | 22.96 | 106.3/km2 |
| Centreville | Village | Carleton | 1966 | 508 | 557 | −8.8% | 2.67 | 190.3/km2 |
| Charlo | Village | Restigouche | 1966 | 1,323 | 1,310 | +1.0% | 31.45 | 42.1/km2 |
| Chipman | Village | Queens | 1966 | 1,201 | 1,104 | +8.8% | 19.00 | 63.2/km2 |
| Doaktown | Village | Northumberland | 1966 | 808 | 792 | +2.0% | 29.09 | 27.8/km2 |
| Dorchester | Village | Westmorland | 1966 | 906 | 1,096 | −17.3% | 5.71 | 158.7/km2 |
| Drummond | Village | Victoria | 1967 | 729 | 737 | −1.1% | 8.88 | 82.1/km2 |
| Eel River Crossing | Village | Restigouche | 1966 | 1,844 | 1,953 | −5.6% | 65.26 | 28.3/km2 |
| Fredericton Junction | Village | Sunbury | 1966 | 719 | 704 | +2.1% | 23.85 | 30.1/km2 |
| Gagetown | Village | Queens | 1966 | 787 | 711 | +10.7% | 49.32 | 16.0/km2 |
| Grand Manan | Village | Charlotte | 1995 | 2,595 | 2,360 | +10.0% | 150.56 | 17.2/km2 |
| Grande-Anse | Village | Gloucester | 1968 | 731 | 899 | −18.7% | 24.27 | 30.1/km2 |
| Harvey | Village | York | 1966 | 402 | 358 | +12.3% | 2.46 | 163.4/km2 |
| Hillsborough | Village | Albert | 1966 | 1,348 | 1,277 | +5.6% | 12.81 | 105.2/km2 |
| Lac Baker | Village | Madawaska | 1967 | 685 | 690 | −0.7% | 37.24 | 18.4/km2 |
| Le Goulet | Village | Gloucester | 1986 | 749 | 793 | −5.5% | 5.40 | 138.7/km2 |
| Maisonnette | Village | Gloucester | 1986 | 535 | 495 | +8.1% | 12.91 | 41.4/km2 |
| McAdam | Village | York | 1966 | 1,173 | 1,151 | +1.9% | 14.19 | 82.7/km2 |
| Meductic | Village | York | 1966 | 180 | 215 | −16.3% | 6.26 | 28.8/km2 |
| Memramcook | Village | Westmorland | 1995 | 5,029 | 4,778 | +5.3% | 186.64 | 26.9/km2 |
| Millville | Village | York | 1966 | 274 | 273 | +0.4% | 12.14 | 22.6/km2 |
| Minto | Village | Queens | 1966 | 2,234 | 2,305 | −3.1% | 31.36 | 71.2/km2 |
| Neguac | Village | Northumberland | 1967 | 1,692 | 1,684 | +0.5% | 26.72 | 63.3/km2 |
| New Maryland | Village | York | 1991 | 4,153 | 4,174 | −0.5% | 21.25 | 195.4/km2 |
| Nigadoo | Village | Gloucester | 1967 | 997 | 963 | +3.5% | 7.65 | 130.3/km2 |
| Norton | Village | Kings | 1966 | 1,410 | 1,382 | +2.0% | 75.35 | 18.7/km2 |
| Paquetville | Village | Gloucester | 1966 | 718 | 720 | −0.3% | 9.26 | 77.5/km2 |
| Perth-Andover | Village | Victoria | 1966 | 1,574 | 1,590 | −1.0% | 8.96 | 175.7/km2 |
| Petitcodiac | Village | Westmorland | 1966 | 1,476 | 1,383 | +6.7% | 17.18 | 85.9/km2 |
| Petit-Rocher | Village | Gloucester | 1966 | 1,954 | 1,897 | +3.0% | 4.52 | 432.3/km2 |
| Plaster Rock | Village | Victoria | 1966 | 1,002 | 1,023 | −2.1% | 3.01 | 332.9/km2 |
| Pointe-Verte | Village | Gloucester | 1966 | 865 | 886 | −2.4% | 13.76 | 62.9/km2 |
| Port Elgin | Village | Westmorland | 1922 | 381 | 408 | −6.6% | 2.65 | 143.8/km2 |
| Rexton | Village | Kent | 1966 | 874 | 830 | +5.3% | 6.29 | 139.0/km2 |
| Riverside-Albert | Village | Albert | 1966 | 348 | 350 | −0.6% | 3.39 | 102.7/km2 |
| Rivière-Verte | Village | Madawaska | 1966 | 744 | 724 | +2.8% | 6.91 | 107.7/km2 |
| Rogersville | Village | Northumberland | 1966 | 1,193 | 1,166 | +2.3% | 7.19 | 165.9/km2 |
| Saint-Antoine | Village | Kent | 1966[b] | 1,791 | 1,733 | +3.3% | 6.32 | 283.4/km2 |
| Sainte-Anne-de-Madawaska | Village | Madawaska | 1966 | 891 | 957 | −6.9% | 8.97 | 99.3/km2 |
| Sainte-Marie-Saint-Raphaël | Village | Gloucester | 1966 | 820 | 879 | −6.7% | 15.84 | 51.8/km2 |
| Saint-Isidore | Village | Gloucester | 1978 | 810 | 764 | +6.0% | 22.94 | 35.3/km2 |
| Saint-Léolin | Village | Gloucester | 1966 | 615 | 647 | −4.9% | 19.73 | 31.2/km2 |
| Saint-Louis de Kent | Village | Kent | 1986 | 981 | 856 | +14.6% | 1.98 | 495.5/km2 |
| Salisbury | Village | Westmorland | 1966 | 2,387 | 2,284 | +4.5% | 13.56 | 176.0/km2 |
| St. Martins | Village | Saint John | 1966 | 320 | 276 | +15.9% | 2.35 | 136.2/km2 |
| Stanley | Village | York | 1966 | 397 | 412 | −3.6% | 16.93 | 23.4/km2 |
| Sussex Corner | Village | Kings | 1966 | 1,458 | 1,461 | −0.2% | 9.32 | 156.4/km2 |
| Tide Head | Village | Restigouche | 1966 | 951 | 938 | +1.4% | 19.34 | 49.2/km2 |
| Tracy | Village | Sunbury | 1966 | 610 | 608 | +0.3% | 29.44 | 20.7/km2 |
| Total cities | — | — | — | 293,928 | 276,466 | +6.3% | 1,063.22 | 276.5/km2 |
| Total regional municipality | — | — | — | 16,043 | 16,114 | −0.4% | 516.55 | 31.1/km2 |
| Total rural communities | — | — | — | 24,842 | 24,394 | +1.8% | 3,781.97 | 6.6/km2 |
| Total towns | — | — | — | 133,350 | 128,746 | +3.6% | 644.44 | 206.9/km2 |
| Total villages | — | — | — | 71,186 | 70,855 | +0.5% | 1,769.24 | 40.2/km2 |
| Total municipalities | — | — | — | 539,349 | 516,575 | +4.4% | 7,775.42 | 69.4/km2 |
| Province of New Brunswick | — | — | — | 775,610 | 747,101 | +3.8% | 71,248.50 | 10.9/km2 |
See also[]
- Demographics of New Brunswick
- Geography of New Brunswick
- List of census agglomerations in Atlantic Canada
- List of communities in New Brunswick
- List of designated places in New Brunswick
- List of local service districts in New Brunswick
- List of municipal amalgamations in New Brunswick
- List of parishes in New Brunswick
- List of population centres in New Brunswick
- New Brunswick municipal elections, 2016
Notes[]
References[]
- ^ "Population and dwelling counts, for Canada, provinces and territories, 2016 and 2011 censuses – 100% data". Statistics Canada. February 8, 2017. Retrieved February 11, 2017.
- ^ "Welcome to the Association of Municipal Administrators of New Brunswick". The Association of Municipal Administrators of New Brunswick. 2015. Retrieved August 16, 2015.
- ^ a b c d e "Municipalities Act (R.S.N.B. 1973, c. M-22)". Government of New Brunswick. 1973. Retrieved April 24, 2015.
- ^ a b c d e f g h i "Types of Local Governments". Government of New Brunswick. 2015. Retrieved March 20, 2015.
- ^ "Community Profiles". Government of New Brunswick. 2015. Retrieved January 17, 2016.
- ^ "Municipalities (Cities, Towns, Villages) and Rural Communities". Government of New Brunswick. Retrieved January 6, 2016.
- ^ "Provincial Archives of New Brunswick". Government of New Brunswick. 2015. Retrieved January 17, 2016.
- ^ a b c d e f g h i j k l "Population and dwelling counts, for Canada, provinces and territories, and census subdivisions (municipalities), 2016 and 2011 censuses – 100% data (New Brunswick)". Statistics Canada. February 8, 2017. Retrieved February 11, 2017.
- ^ a b "Establishing the Regional Municipality of Grand Tracadie-Sheila" (PDF). New Brunswick Department of Environment and Local Government. February 2014. Archived from the original (PDF) on July 21, 2017. Retrieved September 20, 2014.
- ^ a b "Rural Community of Kedgwick Regulation – Municipalities Act" (PDF). Queen's Printer for New Brunswick. March 15, 2012. p. 2. Retrieved September 22, 2014.
- ^ a b "Rural Community of Cocagne Regulation – Municipalities Act" (PDF). Queen's Printer for New Brunswick. March 28, 2014. p. 2. Retrieved September 22, 2014.
- ^ a b "Rural Community of Hanwell Regulation – Municipalities Act" (PDF). Queen's Printer for New Brunswick. March 28, 2014. p. 2. Retrieved September 22, 2014.
- ^ Kedgwick was incorporated as a rural community through the amalgamation of the former Village of Kedgwick with the former local service district of the parish of Grimmer,[10] while Cocagne and Hanwell were previously local service districts.[11][12]
- ^ a b "New Brunswick Regulation 2017-3 under the Municipalities Act". Government of New Brunswick. March 20, 2017. Retrieved February 25, 2018.
- ^ a b "Population and dwelling counts: Canada, provinces and territories, census divisions and census subdivisions (municipalities), New Brunswick". Statistics Canada. February 9, 2022. Retrieved February 21, 2022.
- ^ a b c "Provincial Archives of New Brunswick". Government of New Brunswick. 2015. Retrieved March 6, 2015.
- ^ "Regional Municipality of Grand Tracadie-Sheila Regulation – Municipalities Act" (PDF). Government of New Brunswick Office of the Attorney General. March 28, 2014. p. 3. Retrieved September 17, 2014.
- ^ "Rural Community of Beaubassin East Regulation – Municipalities Act" (PDF). Queen's Printer for New Brunswick. March 24, 1995. p. 6. Retrieved September 22, 2014.
- ^ "Rural Community of Campobello Island Regulation – Municipalities Act" (PDF). Queen's Printer for New Brunswick. August 31, 2010. p. 2. Retrieved September 22, 2014.
- ^ "Rural Community of Saint-André Regulation – Municipalities Act" (PDF). Queen's Printer for New Brunswick. May 26, 2006. p. 4. Retrieved September 22, 2014.
- ^ "Rural Community of Upper Miramichi Regulation – Municipalities Act" (PDF). Queen's Printer for New Brunswick. March 17, 2008. p. 4. Retrieved September 22, 2014.
External links[]
- Lists of populated places in New Brunswick
- Municipalities in New Brunswick
- New Brunswick-related lists