List of municipalities in Quebec
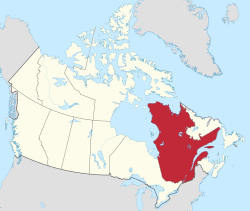
Quebec is the second-most populous province in Canada with 8,164,361 residents as of 2016 and is the largest in land area at 1,356,625 km2 (523,796 sq mi).[1] In 2016, Quebec's 1,108 municipalities covered 37.7% of the province's land mass yet were home to 99.3% of its population.[2][3]
The Government of Quebec's Ministry of Municipal Affairs and Land Occupancy recognizes seven types of municipalities – cities (cités), towns (villes), villages (villages), parishes (paroisses), townships (cantons), united townships (cantons unis), and municipalities (municipalités).[2] All municipalities (except cities), are functionally and legally identical. In some cases, the designation serves to disambiguate between otherwise identically-named municipalities. Municipalities are governed primarily by the Code municipal du Québec (Municipal Code of Québec, R.S.Q. c. C-27.1),[4] whereas cities and towns are governed by the Loi sur les cités et villes (Cities and Towns Act, R.S.Q. c. C-19)[5] as well as (in the case of the older ones) various individual charters.
Of Quebec's 1,108 municipalities, 652 or 59% of them are simply "municipalities". Among the remaining 456, there are 227 towns, 43 villages, 142 parishes, 42 townships, and 2 united townships. Despite still being a legal municipal status, there are no longer any cities in Quebec.
In 2016, 21% of Quebec's population resided in Montreal, its largest municipality. L'Île-Dorval and Saint-Louis-de-Gonzague-du-Cap-Tourmente are Quebec's smallest municipalities by population with 5 people each.[3] The largest municipality by land area is Eeyou Istchee James Bay at 297,355.46 km2 (114,809.58 sq mi), while the smallest by land area is Notre-Dame-des-Anges at 0.04 km2 (0.015 sq mi).[3]
Types of munipalities[]
Towns[]
Quebec has 227 towns (French: villes) that had a cumulative population of 6,827,286 in the 2016 Canadian Census.[2][3] Quebec's largest and smallest towns by population are Montreal and L'Île-Dorval with populations of 1,704,694 and 5.[3] Quebec's largest and smallest towns by land area are La Tuque and L'Île-Dorval with 25,112.41 km2 (9,695.96 sq mi) and 0.19 km2 (0.073 sq mi).[3]
Villages[]
Quebec has 43 villages that had a cumulative population of 44,067 in the 2016 Canadian Census.[2][3][6] Quebec's largest village is Val-David with a population of 4,917, while Kingsbury is province's smallest village with a population of 138.[3] Quebec's largest and smallest villages by area are Baie-Trinité and Lac-Poulin with land areas of 424.38 km2 (163.85 sq mi) and 0.88 km2 (0.34 sq mi).[3]
Parishes[]
Quebec has 136 parishes (French: paroisses) that had a cumulative population of 142,373 in the 2016 Canadian Census.[2][3][6] Quebec's largest and smallest parishes Notre-Dame-du-Mont-Carmel and Saint-Louis-de-Gonzague-du-Cap-Tourmente with populations of 5,751 and 5.[3] Quebec's largest and smallest parishes by land area are Saint-Alexis-des-Monts and Notre-Dame-des-Anges with 1,048.39 km2 (404.79 sq mi) and 0.04 km2 (0.015 sq mi).[3]
Townships[]
Quebec has 42 townships (French: cantons) that had a cumulative population of 45,333 and in the 2016 Canadian Census.[2][3][6] Quebec's largest and smallest townships by population are Shefford and Ristigouche-Partie-Sud-Est with populations of 6,947 and 171.[3] Quebec's largest and smallest townships by area are Nédélec and Bedford with land areas of 374.10 km2 (144.44 sq mi) and 31.98 km2 (12.35 sq mi).[3]
United townships[]
Quebec has two united townships (French: cantons unis). Stoneham-et-Tewkesbury, the larger united township, had a population of 8,359 in the 2016 Canadian Census, while Latulipe-et-Gaboury had a population of 295.[3]
Municipalities[]
Quebec has 658 municipalities that are simply designated "municipalities" (French: municipalités). They had a cumulative population of 1,037,909 in the 2016 Canadian Census.[2][3][6] Quebec's largest and smallest municipalities are Sainte-Sophie and Saint-Benoît-du-Lac with populations of 15,690 and 32.[3] Quebec's largest and smallest municipalities by land area are Eeyou Istchee James Bay and Howick with 297,355.46 km2 (114,809.58 sq mi) and 0.97 km2 (0.37 sq mi).[3]
List of municipalities[]
- Largest municipalities in Quebec by population

Downtown Montreal, Quebec's most populous municipality

Quebec City, the capital and second-largest municipality of Quebec by population

An aerial photo of Laval, a suburb of Montreal and Quebec's third-most populous municipality

A view of downtown Gatineau, Quebec's fourth-largest municipality by population, from the nation's capital city Ottawa

A street in central Longueuil, a suburb of Montreal and Quebec's fifth-largest municipality by population

A street and cars in downtown Sherbrooke, Quebec's sixth-most populous municipality


| Name | Status[2] | Regional county municipality[2] or equivalent territory [citation needed] |
2016 Census of Population[3] | ||||
|---|---|---|---|---|---|---|---|
| Population (2016) |
Population (2011) |
Change | Land area (km²) |
Population density | |||
| Abercorn | Village | Brome-Missisquoi | 334 | 391 | −14.6% | 26.72 | 12.5/km2 |
| Acton Vale | Town | Acton | 7,656 | 7,664 | −0.1% | 91.10 | 84.0/km2 |
| Adstock | Municipality | Les Appalaches | 2,806 | 2,643 | +6.2% | 290.30 | 9.7/km2 |
| Aguanish | Minganie | 245 | 278 | −11.9% | 586.40 | 0.4/km2 | |
| Albanel | Maria-Chapdelaine | 2,262 | 2,293 | −1.4% | 198.11 | 11.4/km2 | |
| Albertville | La Matapédia | 226 | 256 | −11.7% | 103.24 | 2.2/km2 | |
| Alleyn-et-Cawood | Pontiac | 172 | 193 | −10.9% | 314.83 | 0.5/km2 | |
| Alma | Town | Lac-Saint-Jean-Est | 30,776 | 30,904 | −0.4% | 196.54 | 156.6/km2 |
| Amherst | Township | Les Laurentides | 1,484 | 1,524 | −2.6% | 230.22 | 6.4/km2 |
| Amos | Town | Abitibi | 12,823 | 12,671 | +1.2% | 430.29 | 29.8/km2 |
| Amqui | La Matapédia | 6,178 | 6,322 | −2.3% | 121.17 | 51.0/km2 | |
| Ange-Gardien | Municipality | Rouville | 2,699 | 2,420 | +11.5% | 90.23 | 29.9/km2 |
| Armagh | Bellechasse | 1,488 | 1,491 | −0.2% | 168.04 | 8.9/km2 | |
| Arundel | Township | Les Laurentides | 563 | 604 | −6.8% | 64.20 | 8.8/km2 |
| Ascot Corner | Municipality | Le Haut-Saint-François | 3,158 | 2,891 | +9.2% | 81.83 | 38.6/km2 |
| Aston-Jonction | Nicolet-Yamaska | 424 | 410 | +3.4% | 26.22 | 16.2/km2 | |
| Auclair | Témiscouata | 448 | 444 | +0.9% | 105.44 | 4.2/km2 | |
| Audet | Le Granit | 734 | 724 | +1.4% | 135.05 | 5.4/km2 | |
| Aumond | Township | La Vallée-de-la-Gatineau | 754 | 725 | +4.0% | 214.74 | 3.5/km2 |
| Austin | Municipality | Memphrémagog | 1,485 | 1,430 | +3.8% | 73.78 | 20.1/km2 |
| Authier | Abitibi-Ouest | 268 | 282 | −5.0% | 143.42 | 1.9/km2 | |
| Authier-Nord | 300 | 273 | +9.9% | 279.94 | 1.1/km2 | ||
| Ayer's Cliff | Village | Memphrémagog | 1,073[6] | 1,109 | −3.2% | 5.52 | 194.4/km2 |
| Baie-Comeau | Town | Manicouagan | 21,536 | 22,113 | −2.6% | 336.59 | 64.0/km2 |
| Baie-des-Sables | Municipality | La Matanie | 628 | 609 | +3.1% | 65.19 | 9.6/km2 |
| Baie-du-Febvre | Nicolet-Yamaska | 988 | 1,010 | −2.2% | 97.21 | 10.2/km2 | |
| Baie-D'Urfé | Town | Montréal | 3,823 | 3,850 | −0.7% | 6.03 | 634.0/km2 |
| Baie-Johan-Beetz | Municipality | Minganie | 86 | 81 | +6.2% | 360.47 | 0.2/km2 |
| Baie-Sainte-Catherine | Charlevoix-Est | 206 | 204 | +1.0% | 236.37 | 0.9/km2 | |
| Baie-Saint-Paul | Town | Charlevoix | 7,146 | 7,332 | −2.5% | 546.48 | 13.1/km2 |
| Baie-Trinité | Village | Manicouagan | 407 | 501 | −18.8% | 424.38 | 1.0/km2 |
| Barkmere | Town | Les Laurentides | 58 | 58 | 0.0% | 17.99 | 3.2/km2 |
| Barnston-Ouest | Municipality | Coaticook | 559[6] | 591 | −5.4% | 99.48 | 5.6/km2 |
| Barraute | Abitibi | 1,968 | 1,980 | −0.6% | 497.46 | 4.0/km2 | |
| Batiscan | Les Chenaux | 903 | 940 | −3.9% | 43.34 | 20.8/km2 | |
| Beaconsfield | Town | Montréal | 19,324 | 19,505 | −0.9% | 11.03 | 1,751.9/km2 |
| Béarn | Municipality | Témiscamingue | 690 | 783 | −11.9% | 501.79 | 1.4/km2 |
| Beauceville | Town | Robert-Cliche | 6,281 | 6,354 | −1.1% | 164.55 | 38.2/km2 |
| Beauharnois | Beauharnois-Salaberry | 12,884 | 12,011 | +7.3% | 69.31 | 185.9/km2 | |
| Beaulac-Garthby | Municipality | Les Appalaches | 905 | 888 | +1.9% | 75.67 | 12.0/km2 |
| Beaumont | Bellechasse | 2,942 | 2,420 | +21.6% | 44.70 | 65.8/km2 | |
| Beaupré | Town | La Côte-de-Beaupré | 3,752 | 3,439 | +9.1% | 22.96 | 163.4/km2 |
| Bécancour | Bécancour | 13,031 | 12,438 | +4.8% | 440.68 | 29.6/km2 | |
| Bedford | Township | Brome-Missisquoi | 687 | 699 | −1.7% | 31.98 | 21.5/km2 |
| Bedford | Town | 2,560 | 2,684 | −4.6% | 4.25 | 602.4/km2 | |
| Bégin | Municipality | Le Fjord-du-Saguenay | 818 | 868 | −5.8% | 191.50 | 4.3/km2 |
| Belcourt | La Vallée-de-l'Or | 225 | 239 | −5.9% | 411.05 | 0.5/km2 | |
| Belleterre | Town | Témiscamingue | 313 | 298 | +5.0% | 551.02 | 0.6/km2 |
| Beloeil | La Vallée-du-Richelieu | 22,458 | 20,783 | +8.1% | 24.40 | 920.4/km2 | |
| Berry | Municipality | Abitibi | 538 | 625 | −13.9% | 577.33 | 0.9/km2 |
| Berthier-sur-Mer | Montmagny | 1,555 | 1,398 | +11.2% | 26.92 | 57.8/km2 | |
| Berthierville | Town | D'Autray | 4,189 | 4,091 | +2.4% | 6.89 | 608.0/km2 |
| Béthanie | Municipality | Acton | 322 | 314 | +2.5% | 46.87 | 6.9/km2 |
| Biencourt | Témiscouata | 464 | 506 | −8.3% | 187.34 | 2.5/km2 | |
| Blainville | Town | Thérèse-De Blainville | 56,863 | 53,510 | +6.3% | 55.16 | 1,030.9/km2 |
| Blanc-Sablon | Municipality | Le Golfe-du-Saint-Laurent | 1,112 | 1,118 | −0.5% | 247.94 | 4.5/km2 |
| Blue Sea | La Vallée-de-la-Gatineau | 639 | 674 | −5.2% | 74.21 | 8.6/km2 | |
| Boileau | Papineau | 335 | 380 | −11.8% | 136.33 | 2.5/km2 | |
| Boisbriand | Town | Thérèse-De Blainville | 26,884 | 26,816 | +0.3% | 27.82 | 966.4/km2 |
| Boischatel | Municipality | La Côte-de-Beaupré | 7,587 | 6,465 | +17.4% | 20.45 | 371.0/km2 |
| Bois-des-Filion | Town | Thérèse-De Blainville | 9,636 | 9,485 | +1.6% | 4.39 | 2,195.0/km2 |
| Bois-Franc | Municipality | La Vallée-de-la-Gatineau | 421 | 447 | −5.8% | 72.25 | 5.8/km2 |
| Bolton-Est | Memphrémagog | 940 | 910 | +3.3% | 79.71 | 11.8/km2 | |
| Bolton-Ouest | Brome-Missisquoi | 630 | 678 | −7.1% | 101.15 | 6.2/km2 | |
| Bonaventure | Town | Bonaventure | 2,706 | 2,775 | −2.5% | 104.35 | 25.9/km2 |
| Bonne-Espérance | Municipality | Le Golfe-du-Saint-Laurent | 681 | 732 | −7.0% | 646.73 | 1.1/km2 |
| Bonsecours | Le Val-Saint-François | 608 | 577 | +5.4% | 60.46 | 10.1/km2 | |
| Boucherville | Town | Longueuil | 41,671 | 40,753 | +2.3% | 70.50 | 591.1/km2 |
| Bouchette | Municipality | La Vallée-de-la-Gatineau | 731 | 786 | −7.0% | 123.44 | 5.9/km2 |
| Bowman | Papineau | 658 | 677 | −2.8% | 129.30 | 5.1/km2 | |
| Brébeuf | Parish | Les Laurentides | 976 | 1,012 | −3.6% | 36.25 | 26.9/km2 |
| Brigham | Municipality | Brome-Missisquoi | 2,306 | 2,457 | −6.1% | 86.92 | 26.5/km2 |
| Bristol | Pontiac | 1,036 | 1,128 | −8.2% | 207.19 | 5.0/km2 | |
| Brome | Village | Brome-Missisquoi | 296 | 271 | +9.2% | 11.57 | 25.6/km2 |
| Bromont | Town | 9,041 | 7,649 | +18.2% | 114.13 | 79.2/km2 | |
| Brossard | Longueuil | 85,721 | 79,273 | +8.1% | 45.23 | 1,895.2/km2 | |
| Brownsburg-Chatham | Argenteuil | 7,122 | 7,209 | −1.2% | 247.40 | 28.8/km2 | |
| Bryson | Municipality | Pontiac | 697 | 647 | +7.7% | 3.65 | 191.0/km2 |
| Bury | Le Haut-Saint-François | 1,174 | 1,159 | +1.3% | 234.39 | 5.0/km2 | |
| Cacouna | Rivière-du-Loup | 1,803 | 1,939 | −7.0% | 62.80 | 28.7/km2 | |
| Calixa-Lavallée | Marguerite-D'Youville | 523 | 504 | +3.8% | 32.21 | 16.2/km2 | |
| Campbell's Bay | Pontiac | 744 | 775 | −4.0% | 3.55 | 209.6/km2 | |
| Candiac | Town | Roussillon | 21,047 | 19,876 | +5.9% | 17.31 | 1,215.9/km2 |
| Cantley | Municipality | Les Collines-de-l'Outaouais | 10,699 | 9,888 | +8.2% | 128.36 | 83.4/km2 |
| Cap-Chat | Town | La Haute-Gaspésie | 2,476 | 2,623 | −5.6% | 182.05 | 13.6/km2 |
| Caplan | Municipality | Bonaventure | 2,024 | 2,039 | −0.7% | 85.31 | 23.7/km2 |
| Cap-Saint-Ignace | Montmagny | 3,089 | 3,045 | +1.4% | 204.71 | 15.1/km2 | |
| Cap-Santé | Town | Portneuf | 3,400 | 2,996 | +13.5% | 54.53 | 62.4/km2 |
| Carignan | La Vallée-du-Richelieu | 9,462 | 7,966 | +18.8% | 62.27 | 152.0/km2 | |
| Carleton-sur-Mer | Avignon | 4,073 | 3,991 | +2.1% | 221.42 | 18.4/km2 | |
| Cascapédia–Saint-Jules | Municipality | Bonaventure | 730 | 741 | −1.5% | 163.45 | 4.5/km2 |
| Causapscal | Town | La Matapédia | 2,304 | 2,458 | −6.3% | 161.60 | 14.3/km2 |
| Cayamant | Municipality | La Vallée-de-la-Gatineau | 821 | 875 | −6.2% | 389.07 | 2.1/km2 |
| Chambly | Town | La Vallée-du-Richelieu | 29,120 | 25,571 | +13.9% | 25.13 | 1,158.8/km2 |
| Chambord | Municipality | Le Domaine-du-Roy | 1,765 | 1,773 | −0.5% | 121.49 | 14.5/km2 |
| Champlain | Les Chenaux | 1,735 | 1,664 | +4.3% | 58.30 | 29.8/km2 | |
| Champneuf | Abitibi | 123 | 127 | −3.1% | 242.81 | 0.5/km2 | |
| Chandler | Town | Le Rocher-Percé | 7,546 | 7,703 | −2.0% | 419.34 | 18.0/km2 |
| Chapais | Jamésie | 1,499 | 1,610 | −6.9% | 63.71 | 23.5/km2 | |
| Charette | Municipality | Maskinongé | 953 | 993 | −4.0% | 41.88 | 22.8/km2 |
| Charlemagne | Town | L'Assomption | 5,913 | 5,853 | +1.0% | 2.19 | 2,700.0/km2 |
| Chartierville | Municipality | Le Haut-Saint-François | 276 | 307 | −10.1% | 142.05 | 1.9/km2 |
| Châteauguay | Town | Roussillon | 47,906 | 45,904 | +4.4% | 35.95 | 1,332.6/km2 |
| Château-Richer | La Côte-de-Beaupré | 4,126 | 3,834 | +7.6% | 229.55 | 18.0/km2 | |
| Chazel | Municipality | Abitibi-Ouest | 289 | 289 | 0.0% | 133.96 | 2.2/km2 |
| Chelsea | Les Collines-de-l'Outaouais | 6,909 | 6,977 | −1.0% | 113.77 | 60.7/km2 | |
| Chénéville | Papineau | 764 | 792 | −3.5% | 66.76 | 11.4/km2 | |
| Chertsey | Matawinie | 4,696 | 4,836 | −2.9% | 288.43 | 16.3/km2 | |
| Chesterville | Arthabaska | 922 | 891 | +3.5% | 116.69 | 7.9/km2 | |
| Chibougamau | Town | Jamésie | 7,504 | 7,541 | −0.5% | 698.13 | 10.7/km2 |
| Chichester | Township | Pontiac | 348[6] | 368 | −5.4% | 221.14 | 1.6/km2 |
| Chute-aux-Outardes | Village | Manicouagan | 1,563 | 1,644 | −4.9% | 7.30 | 214.1/km2 |
| Chute-Saint-Philippe | Parish | Antoine-Labelle | 942 | 892 | +5.6% | 299.98 | 3.1/km2 |
| Clarendon | Municipality | Pontiac | 1,256 | 1,183 | +6.2% | 333.37 | 3.8/km2 |
| Clermont | Township | Abitibi-Ouest | 492 | 482 | +2.1% | 157.45 | 3.1/km2 |
| Clermont | Town | Charlevoix-Est | 3,085 | 3,118 | −1.1% | 51.59 | 59.8/km2 |
| Clerval | Municipality | Abitibi-Ouest | 371 | 364 | +1.9% | 99.60 | 3.7/km2 |
| Cleveland | Township | Le Val-Saint-François | 1,541 | 1,609 | −4.2% | 123.76 | 12.5/km2 |
| Cloridorme | La Côte-de-Gaspé | 671 | 743 | −9.7% | 159.62 | 4.2/km2 | |
| Coaticook | Town | Coaticook | 8,955[6] | 9,255 | −3.2% | 219.51 | 40.8/km2 |
| Colombier | Municipality | La Haute-Côte-Nord | 685 | 747 | −8.3% | 367.32 | 1.9/km2 |
| Compton | Coaticook | 3,131 | 3,112 | +0.6% | 206.65 | 15.2/km2 | |
| Contrecœur | Town | Marguerite-D'Youville | 7,887 | 6,252 | +26.2% | 61.51 | 128.2/km2 |
| Cookshire-Eaton | Le Haut-Saint-François | 5,393 | 5,171 | +4.3% | 296.38 | 18.2/km2 | |
| Côte Saint-Luc | Montréal | 32,448 | 32,321 | +0.4% | 6.96 | 4,662.1/km2 | |
| Coteau-du-Lac | Vaudreuil-Soulanges | 7,044 | 6,842 | +3.0% | 46.89 | 150.2/km2 | |
| Côte-Nord-du-Golfe-du-Saint-Laurent | Le Golfe-du-Saint-Laurent | 856 | 971 | −11.8% | 2,835.23 | 0.3/km2 | |
| Courcelles | Municipality | Le Granit | 823 | 950 | −13.4% | 90.59 | 9.1/km2 |
| Cowansville | Town | Brome-Missisquoi | 13,656 | 12,489 | +9.3% | 46.89 | 291.2/km2 |
| Crabtree | Municipality | Joliette | 3,958 | 3,887 | +1.8% | 25.04 | 158.1/km2 |
| Danville | Town | Les Sources | 3,826 | 4,070 | −6.0% | 151.98 | 25.2/km2 |
| Daveluyville | Arthabaska | 2,255 | 2,234 | +0.9% | 61.85 | 36.5/km2 | |
| Dégelis | Témiscouata | 2,863 | 3,051 | −6.2% | 557.05 | 5.1/km2 | |
| Déléage | Municipality | La Vallée-de-la-Gatineau | 1,852 | 1,856 | −0.2% | 250.33 | 7.4/km2 |
| Delson | Town | Roussillon | 7,457 | 7,462 | −0.1% | 7.63 | 977.3/km2 |
| Denholm | Municipality | La Vallée-de-la-Gatineau | 505 | 572 | −11.7% | 181.14 | 2.8/km2 |
| Desbiens | Town | Lac-Saint-Jean-Est | 1,028 | 1,053 | −2.4% | 10.40 | 98.8/km2 |
| Deschaillons-sur-Saint-Laurent | Municipality | Bécancour | 909 | 954 | −4.7% | 36.59 | 24.8/km2 |
| Deschambault-Grondines | Portneuf | 2,220 | 2,131 | +4.2% | 124.39 | 17.8/km2 | |
| Deux-Montagnes | Town | Deux-Montagnes | 17,496 | 17,552 | −0.3% | 6.09 | 2,872.9/km2 |
| Disraeli | Parish | Les Appalaches | 1,123 | 1,158 | −3.0% | 92.56 | 12.1/km2 |
| Disraeli | Town | 2,336 | 2,502 | −6.6% | 6.79 | 344.0/km2 | |
| Dixville | Municipality | Coaticook | 696 | 710 | −2.0% | 76.65 | 9.1/km2 |
| Dolbeau-Mistassini | Town | Maria-Chapdelaine | 14,250 | 14,384 | −0.9% | 295.49 | 48.2/km2 |
| Dollard-des-Ormeaux | Montréal | 48,899 | 49,637 | −1.5% | 14.97 | 3,266.5/km2 | |
| Donnacona | Portneuf | 7,200 | 6,283 | +14.6% | 20.13 | 357.7/km2 | |
| Dorval | Montréal | 18,980 | 18,208 | +4.2% | 20.91 | 907.7/km2 | |
| Dosquet | Municipality | Lotbinière | 944 | 887 | +6.4% | 65.09 | 14.5/km2 |
| Drummondville | Town | Drummond | 75,423 | 71,852 | +5.0% | 247.15 | 305.2/km2 |
| Dudswell | Municipality | Le Haut-Saint-François | 1,727 | 1,771 | −2.5% | 218.61 | 7.9/km2 |
| Duhamel | Papineau | 430 | 412 | +4.4% | 434.57 | 1.0/km2 | |
| Duhamel-Ouest | Témiscamingue | 878 | 828 | +6.0% | 91.47 | 9.6/km2 | |
| Dundee | Township | Le Haut-Saint-Laurent | 387 | 408 | −5.1% | 69.45 | 5.6/km2 |
| Dunham | Town | Brome-Missisquoi | 3,432 | 3,471 | −1.1% | 194.06 | 17.7/km2 |
| Duparquet | Abitibi-Ouest | 666 | 657 | +1.4% | 123.57 | 5.4/km2 | |
| Dupuy | Municipality | 931 | 930 | +0.1% | 122.68 | 7.6/km2 | |
| Durham-Sud | Drummond | 1,043 | 1,008 | +3.5% | 92.67 | 11.3/km2 | |
| East Angus | Town | Le Haut-Saint-François | 3,659 | 3,741 | −2.2% | 7.89 | 463.8/km2 |
| East Broughton | Municipality | Les Appalaches | 2,199 | 2,229 | −1.3% | 8.87 | 247.9/km2 |
| East Farnham | Brome-Missisquoi | 554 | 553 | +0.2% | 5.03 | 110.1/km2 | |
| East Hereford | Coaticook | 269 | 306 | −12.1% | 72.19 | 3.7/km2 | |
| Eastman | Memphrémagog | 1,843 | 1,740 | +5.9% | 73.69 | 25.0/km2 | |
| Eeyou Istchee James Bay | Jamésie | 1,589 | 1,303 | +21.9% | 297,355.46 | 0.0/km2 | |
| Egan-Sud | La Vallée-de-la-Gatineau | 504 | 542 | −7.0% | 50.62 | 10.0/km2 | |
| Elgin | Le Haut-Saint-Laurent | 394 | 401 | −1.7% | 69.61 | 5.7/km2 | |
| Entrelacs | Matawinie | 928 | 906 | +2.4% | 49.05 | 18.9/km2 | |
| Escuminac | Avignon | 544 | 588 | −7.5% | 108.20 | 5.0/km2 | |
| Esprit-Saint | Rimouski-Neigette | 341 | 379 | −10.0% | 169.40 | 2.0/km2 | |
| Estérel | Town | Les Pays-d'en-Haut | 196 | 199 | −1.5% | 12.57 | 15.6/km2 |
| Farnham | Brome-Missisquoi | 8,909 | 8,330 | +7.0% | 92.26 | 96.6/km2 | |
| Fassett | Municipality | Papineau | 431 | 451 | −4.4% | 12.49 | 34.5/km2 |
| Ferland-et-Boilleau | Le Fjord-du-Saguenay | 540 | 583 | −7.4% | 383.51 | 1.4/km2 | |
| Ferme-Neuve | Antoine-Labelle | 2,706 | 2,822 | −4.1% | 793.44 | 3.4/km2 | |
| Fermont | Town | Caniapiscau | 2,474 | 2,874 | −13.9% | 476.89 | 5.2/km2 |
| Forestville | La Haute-Côte-Nord | 3,081 | 3,270 | −5.8% | 195.05 | 15.8/km2 | |
| Fort-Coulonge | Village | Pontiac | 1,433 | 1,377 | +4.1% | 3.10 | 462.3/km2 |
| Fortierville | Municipality | Bécancour | 669 | 706 | −5.2% | 44.55 | 15.0/km2 |
| Fossambault-sur-le-Lac | Town | La Jacques-Cartier | 1,960 | 1,613 | +21.5% | 11.53 | 170.0/km2 |
| Frampton | Municipality | La Nouvelle-Beauce | 1,297[6] | 1,393 | −6.9% | 151.30 | 8.6/km2 |
| Franklin | Le Haut-Saint-Laurent | 1,636 | 1,688 | −3.1% | 112.60 | 14.5/km2 | |
| Franquelin | Manicouagan | 313 | 324 | −3.4% | 446.08 | 0.7/km2 | |
| Frelighsburg | Brome-Missisquoi | 1,111 | 1,094 | +1.6% | 123.58 | 9.0/km2 | |
| Frontenac | Le Granit | 1,734 | 1,650 | +5.1% | 223.68 | 7.8/km2 | |
| Fugèreville | Témiscamingue | 326 | 329 | −0.9% | 156.98 | 2.1/km2 | |
| Gallichan | Abitibi-Ouest | 468 | 484 | −3.3% | 73.89 | 6.3/km2 | |
| Gaspé | Town | La Côte-de-Gaspé | 14,568 | 15,163 | −3.9% | 1,121.43 | 13.0/km2 |
| Gatineau | Gatineau | 276,245 | 265,349 | +4.1% | 342.80 | 805.8/km2 | |
| Girardville | Municipality | Maria-Chapdelaine | 988 | 1,100 | −10.2% | 124.52 | 7.9/km2 |
| Godbout | Village | Manicouagan | 265 | 298 | −11.1% | 161.60 | 1.6/km2 |
| Godmanchester | Township | Le Haut-Saint-Laurent | 1,394 | 1,417 | −1.6% | 138.80 | 10.0/km2 |
| Gore | Argenteuil | 1,904 | 1,775 | +7.3% | 92.68 | 20.5/km2 | |
| Gracefield | Town | La Vallée-de-la-Gatineau | 2,462 | 2,355 | +4.5% | 386.84 | 6.4/km2 |
| Granby | La Haute-Yamaska | 66,222 | 63,433 | +4.4% | 152.79 | 433.4/km2 | |
| Grand-Métis | Municipality | La Mitis | 213[6] | 237 | −10.1% | 25.55 | 8.3/km2 |
| Grand-Remous | La Vallée-de-la-Gatineau | 1,161 | 1,168 | −0.6% | 355.89 | 3.3/km2 | |
| Grand-Saint-Esprit | Nicolet-Yamaska | 476 | 471 | +1.1% | 27.23 | 17.5/km2 | |
| Grande-Rivière | Town | Le Rocher-Percé | 3,408 | 3,456 | −1.4% | 87.86 | 38.8/km2 |
| Grande-Vallée | Municipality | La Côte-de-Gaspé | 1,057 | 1,137 | −7.0% | 144.50 | 7.3/km2 |
| Grandes-Piles | Village | Mékinac | 415 | 361 | +15.0% | 120.61 | 3.4/km2 |
| Grenville | Argenteuil | 1,711 | 1,577 | +8.5% | 2.87 | 596.2/km2 | |
| Grenville-sur-la-Rouge | Municipality | 2,824 | 2,746 | +2.8% | 317.65 | 8.9/km2 | |
| Gros-Mécatina | Le Golfe-du-Saint-Laurent | 428 | 499 | −14.2% | 790.07 | 0.5/km2 | |
| Grosse-Île | Les Îles-de-la-Madeleine | 465 | 490 | −5.1% | 37.59 | 12.4/km2 | |
| Grosses-Roches | La Matanie | 394[6] | 411 | −4.1% | 64.00 | 6.2/km2 | |
| Guérin | Township | Témiscamingue | 320 | 305 | +4.9% | 190.23 | 1.7/km2 |
| Ham-Nord | Arthabaska | 869 | 832 | +4.4% | 102.93 | 8.4/km2 | |
| Ham-Sud | Municipality | Les Sources | 235 | 225 | +4.4% | 151.50 | 1.6/km2 |
| Hampden | Township | Le Haut-Saint-François | 176 | 214 | −17.8% | 111.88 | 1.6/km2 |
| Hampstead | Town | Montréal | 6,973 | 7,153 | −2.5% | 1.80 | 3,873.9/km2 |
| Harrington | Township | Argenteuil | 846 | 853 | −0.8% | 237.09 | 3.6/km2 |
| Hatley | Municipality | Memphrémagog | 685[6] | 761 | −10.0% | 60.42 | 11.3/km2 |
| Hatley | Township | 2,106 | 2,003 | +5.1% | 71.75 | 29.4/km2 | |
| Havelock | Le Haut-Saint-Laurent | 740 | 756 | −2.1% | 88.95 | 8.3/km2 | |
| Havre-Saint-Pierre | Municipality | Minganie | 3,460 | 3,418 | +1.2% | 2,817.92 | 1.2/km2 |
| Hébertville | Lac-Saint-Jean-Est | 2,542[6] | 2,441 | +4.1% | 261.06 | 9.7/km2 | |
| Hébertville-Station | Village | 1,311 | 1,216 | +7.8% | 31.63 | 41.4/km2 | |
| Hemmingford | Township | Les Jardins-de-Napierville | 1,900 | 1,747 | +8.8% | 157.59 | 12.1/km2 |
| Hemmingford | Village | 755 | 808 | −6.6% | 0.91 | 829.7/km2 | |
| Henryville | Municipality | Le Haut-Richelieu | 1,406 | 1,464 | −4.0% | 65.41 | 21.5/km2 |
| Hérouxville | Parish | Mékinac | 1,278 | 1,340 | −4.6% | 53.01 | 24.1/km2 |
| Hinchinbrooke | Municipality | Le Haut-Saint-Laurent | 2,103 | 2,242 | −6.2% | 149.30 | 14.1/km2 |
| Honfleur | Bellechasse | 849 | 765 | +11.0% | 50.68 | 16.8/km2 | |
| Hope | Township | Bonaventure | 568 | 630 | −9.8% | 70.55 | 8.1/km2 |
| Hope Town | Municipality | 339 | 344 | −1.5% | 50.91 | 6.7/km2 | |
| Howick | Le Haut-Saint-Laurent | 778 | 630 | +23.5% | 0.97 | 802.1/km2 | |
| Huberdeau | Les Laurentides | 868 | 894 | −2.9% | 57.04 | 15.2/km2 | |
| Hudson | Town | Vaudreuil-Soulanges | 5,185 | 5,135 | +1.0% | 21.87 | 237.1/km2 |
| Huntingdon | Le Haut-Saint-Laurent | 2,444 | 2,457 | −0.5% | 2.78 | 879.1/km2 | |
| Inverness | Municipality | L'Érable | 899 | 822 | +9.4% | 176.07 | 5.1/km2 |
| Irlande | Les Appalaches | 884 | 959 | −7.8% | 109.54 | 8.1/km2 | |
| Ivry-sur-le-Lac | Les Laurentides | 387 | 425 | −8.9% | 29.67 | 13.0/km2 | |
| Joliette | Town | Joliette | 20,484 | 19,621 | +4.4% | 22.97 | 891.8/km2 |
| Kamouraska | Municipality | Kamouraska | 616 | 589 | +4.6% | 43.86 | 14.0/km2 |
| Kazabazua | La Vallée-de-la-Gatineau | 945 | 847 | +11.6% | 175.09 | 5.4/km2 | |
| Kiamika | Antoine-Labelle | 757 | 772 | −1.9% | 339.92 | 2.2/km2 | |
| Kingsbury | Village | Le Val-Saint-François | 138 | 148 | −6.8% | 6.18 | 22.3/km2 |
| Kingsey Falls | Town | Arthabaska | 1,947 | 2,000 | −2.6% | 69.64 | 28.0/km2 |
| Kinnear's Mills | Municipality | Les Appalaches | 350 | 369 | −5.1% | 93.70 | 3.7/km2 |
| Kipawa | Témiscamingue | 516 | 474 | +8.9% | 36.59 | 14.1/km2 | |
| Kirkland | Town | Montréal | 20,151 | 21,253 | −5.2% | 9.63 | 2,092.5/km2 |
| La Bostonnais | Municipality | La Tuque | 635 | 503 | +26.2% | 287.09 | 2.2/km2 |
| La Conception | Les Laurentides | 1,337 | 1,287 | +3.9% | 129.12 | 10.4/km2 | |
| La Corne | Abitibi | 719 | 700 | +2.7% | 310.54 | 2.3/km2 | |
| La Dor�� | Parish | Le Domaine-du-Roy | 1,365 | 1,453 | −6.1% | 289.80 | 4.7/km2 |
| La Durantaye | Bellechasse | 755 | 722 | +4.6% | 35.00 | 21.6/km2 | |
| La Guadeloupe | Village | Beauce-Sartigan | 1,707 | 1,787 | −4.5% | 32.88 | 51.9/km2 |
| La Macaza | Municipality | Antoine-Labelle | 1,150 | 1,053 | +9.2% | 163.48 | 7.0/km2 |
| La Malbaie | Town | Charlevoix-Est | 8,271 | 8,862 | −6.7% | 459.24 | 18.0/km2 |
| La Martre | Municipality | La Haute-Gaspésie | 243 | 245 | −0.8% | 175.46 | 1.4/km2 |
| La Minerve | Les Laurentides | 1,205 | 1,234 | −2.4% | 278.49 | 4.3/km2 | |
| La Morandière | Abitibi | 207 | 233 | −11.2% | 410.40 | 0.5/km2 | |
| La Motte | 453 | 457 | −0.9% | 176.90 | 2.6/km2 | ||
| La Patrie | Le Haut-Saint-François | 768 | 749 | +2.5% | 204.82 | 3.7/km2 | |
| La Pêche | Les Collines-de-l'Outaouais | 7,863 | 7,619 | +3.2% | 585.93 | 13.4/km2 | |
| La Pocatière | Town | Kamouraska | 4,120 | 4,266 | −3.4% | 21.63 | 190.5/km2 |
| La Prairie | Roussillon | 24,110 | 23,357 | +3.2% | 43.68 | 552.0/km2 | |
| La Présentation | Municipality | Les Maskoutains | 2,540 | 2,466 | +3.0% | 94.40 | 26.9/km2 |
| La Rédemption | Parish | La Mitis | 432 | 488 | −11.5% | 117.17 | 3.7/km2 |
| La Reine | Municipality | Abitibi-Ouest | 339 | 340 | −0.3% | 97.93 | 3.5/km2 |
| La Sarre | Town | 7,282 | 7,719 | −5.7% | 148.50 | 49.0/km2 | |
| La Trinité-des-Monts | Parish | Rimouski-Neigette | 223 | 256 | −12.9% | 234.23 | 1.0/km2 |
| La Tuque | Town | La Tuque | 11,001 | 11,227 | −2.0% | 25,112.41 | 0.4/km2 |
| La Visitation-de-l'Île-Dupas | Municipality | D'Autray | 626 | 619 | +1.1% | 30.60 | 20.5/km2 |
| La Visitation-de-Yamaska | Nicolet-Yamaska | 327 | 331 | −1.2% | 42.71 | 7.7/km2 | |
| Labelle | Les Laurentides | 2,477 | 2,445 | +1.3% | 198.47 | 12.5/km2 | |
| Labrecque | Lac-Saint-Jean-Est | 1,321 | 1,215 | +8.7% | 153.07 | 8.6/km2 | |
| Lac-au-Saumon | La Matapédia | 1,450 | 1,453 | −0.2% | 81.08 | 17.9/km2 | |
| Lac-aux-Sables | Parish | Mékinac | 1,292 | 1,373 | −5.9% | 271.58 | 4.8/km2 |
| Lac-Beauport | Municipality | La Jacques-Cartier | 7,801 | 7,327 | +6.5% | 61.79 | 126.3/km2 |
| Lac-Bouchette | Le Domaine-du-Roy | 1,196 | 1,174 | +1.9% | 909.69 | 1.3/km2 | |
| Lac-Brome | Town | Brome-Missisquoi | 5,495 | 5,609 | −2.0% | 207.29 | 26.5/km2 |
| Lac-Delage | La Jacques-Cartier | 638 | 598 | +6.7% | 1.59 | 401.3/km2 | |
| Lac-des-Aigles | Municipality | Témiscouata | 512 | 551 | −7.1% | 86.67 | 5.9/km2 |
| Lac-des-Écorces | Antoine-Labelle | 2,734 | 2,713 | +0.8% | 144.90 | 18.9/km2 | |
| Lac-des-Plages | Papineau | 431 | 522 | −17.4% | 152.94 | 2.8/km2 | |
| Lac-des-Seize-Îles | Les Pays-d'en-Haut | 172 | 223 | −22.9% | 8.96 | 19.2/km2 | |
| Lac-Drolet | Le Granit | 1,021 | 1,071 | −4.7% | 124.42 | 8.2/km2 | |
| Lac-du-Cerf | Antoine-Labelle | 435 | 415 | +4.8% | 73.29 | 5.9/km2 | |
| Lac-Édouard | La Tuque | 191 | 175 | +9.1% | 916.50 | 0.2/km2 | |
| Lac-Etchemin | Les Etchemins | 3,822 | 4,061 | −5.9% | 157.21 | 24.3/km2 | |
| Lac-Frontière | Montmagny | 184 | 198 | −7.1% | 50.13 | 3.7/km2 | |
| Lac-Mégantic | Town | Le Granit | 5,654 | 5,932 | −4.7% | 21.95 | 257.6/km2 |
| Lac-Poulin | Village | Beauce-Sartigan | 147 | 134 | +9.7% | 0.88 | 167.0/km2 |
| Lac-Saguay | Antoine-Labelle | 459 | 446 | +2.9% | 172.97 | 2.7/km2 | |
| Lac-Saint-Joseph | Town | La Jacques-Cartier | 260 | 251 | +3.6% | 33.69 | 7.7/km2 |
| Lac-Saint-Paul | Municipality | Antoine-Labelle | 481 | 481 | 0.0% | 171.57 | 2.8/km2 |
| Lac-Sainte-Marie | La Vallée-de-la-Gatineau | 566 | 611 | −7.4% | 208.81 | 2.7/km2 | |
| Lac-Sergent | Town | Portneuf | 497 | 466 | +6.7% | 3.76 | 132.2/km2 |
| Lac-Simon | Municipality | Papineau | 944 | 984 | −4.1% | 97.48 | 9.7/km2 |
| Lac-Supérieur | Les Laurentides | 1,888 | 1,892 | −0.2% | 367.21 | 5.1/km2 | |
| Lac-Tremblant-Nord | 42 | 47 | −10.6% | 20.90 | 2.0/km2 | ||
| Lachute | Town | Argenteuil | 12,862 | 12,551 | +2.5% | 109.96 | 117.0/km2 |
| Lacolle | Municipality | Le Haut-Richelieu | 2,596 | 2,680 | −3.1% | 49.42 | 52.5/km2 |
| Laforce | Témiscamingue | 231 | 245 | −5.7% | 439.48 | 0.5/km2 | |
| Lamarche | Lac-Saint-Jean-Est | 514 | 557 | −7.7% | 82.71 | 6.2/km2 | |
| Lambton | Le Granit | 1,617 | 1,584 | +2.1% | 108.72 | 14.9/km2 | |
| L'Ancienne-Lorette | Town | Québec | 16,543 | 16,745 | −1.2% | 7.72 | 2,142.9/km2 |
| Landrienne | Township | Abitibi | 967 | 977 | −1.0% | 277.38 | 3.5/km2 |
| L'Ange-Gardien | Municipality | La Côte-de-Beaupré | 3,695 | 3,634 | +1.7% | 53.63 | 68.9/km2 |
| L'Ange-Gardien | Les Collines-de-l'Outaouais | 5,464 | 5,051 | +8.2% | 218.25 | 25.0/km2 | |
| Lanoraie | D'Autray | 4,787 | 4,447 | +7.6% | 103.08 | 46.4/km2 | |
| L'Anse-Saint-Jean | Le Fjord-du-Saguenay | 1,201 | 1,208 | −0.6% | 506.14 | 2.4/km2 | |
| Lantier | Les Laurentides | 834 | 828 | +0.7% | 48.51 | 17.2/km2 | |
| Larouche | Le Fjord-du-Saguenay | 1,486 | 1,277 | +16.4% | 85.21 | 17.4/km2 | |
| L'Ascension | Antoine-Labelle | 791 | 844 | −6.3% | 340.85 | 2.3/km2 | |
| L'Ascension-de-Notre-Seigneur | Parish | Lac-Saint-Jean-Est | 1,987 | 1,983 | +0.2% | 131.93 | 15.1/km2 |
| L'Ascension-de-Patapédia | Municipality | Avignon | 164 | 190 | −13.7% | 95.93 | 1.7/km2 |
| L'Assomption | Town | L'Assomption | 22,429 | 20,065 | +11.8% | 98.99 | 226.6/km2 |
| Latulipe-et-Gaboury | United township | Témiscamingue | 295 | 304 | −3.0% | 270.42 | 1.1/km2 |
| Launay | Township | Abitibi | 218 | 229 | −4.8% | 258.51 | 0.8/km2 |
| Laurier-Station | Village | Lotbinière | 2,573 | 2,634 | −2.3% | 12.16 | 211.6/km2 |
| Laurierville | Municipality | L'Érable | 1,346 | 1,454 | −7.4% | 108.05 | 12.5/km2 |
| Laval | Town | Laval | 422,993 | 401,553 | +5.3% | 247.23 | 1,710.9/km2 |
| Lavaltrie | D'Autray | 13,657 | 13,267 | +2.9% | 68.39 | 199.7/km2 | |
| L'Avenir | Municipality | Drummond | 1,307 | 1,202 | +8.7% | 97.72 | 13.4/km2 |
| Laverlochère-Angliers | Témiscamingue | 978 | 1,029 | −5.0% | 403.29 | 2.4/km2 | |
| Lawrenceville | Village | Le Val-Saint-François | 635 | 652 | −2.6% | 16.74 | 37.9/km2 |
| Lebel-sur-Quévillon | Town | Jamésie | 2,187 | 2,159 | +1.3% | 40.89 | 53.5/km2 |
| Leclercville | Municipality | Lotbinière | 473 | 477 | −0.8% | 136.50 | 3.5/km2 |
| Lefebvre | Drummond | 904 | 867 | +4.3% | 66.19 | 13.7/km2 | |
| Lejeune | Témiscouata | 262 | 286 | −8.4% | 270.79 | 1.0/km2 | |
| Lemieux | Bécancour | 301 | 304 | −1.0% | 74.75 | 4.0/km2 | |
| L'Épiphanie | Town | L'Assomption | 8,693 | 8,651 | +0.5% | 56.88 | 152.8/km2 |
| Léry | Town | Roussillon | 2,318 | 2,307 | +0.5% | 10.53 | 220.1/km2 |
| Les Bergeronnes | Municipality | La Haute-Côte-Nord | 661 | 693 | −4.6% | 274.26 | 2.4/km2 |
| Les Cèdres | Vaudreuil-Soulanges | 6,777 | 6,079 | +11.5% | 77.71 | 87.2/km2 | |
| Les Coteaux | 5,368 | 4,568 | +17.5% | 11.63 | 461.6/km2 | ||
| Les Éboulements | Charlevoix | 1,331 | 1,328 | +0.2% | 156.49 | 8.5/km2 | |
| Les Escoumins | La Haute-Côte-Nord | 1,891 | 2,000 | −5.4% | 271.47 | 7.0/km2 | |
| Les Hauteurs | La Mitis | 504 | 524 | −3.8% | 103.04 | 4.9/km2 | |
| Les Îles-de-la-Madeleine | Les Îles-de-la-Madeleine | 12,010 | 12,291 | −2.3% | 172.71 | 69.5/km2 | |
| Les Méchins | La Matanie | 987 | 1,107 | −10.8% | 443.40 | 2.2/km2 | |
| Lévis | Town | Lévis | 143,414 | 138,769 | +3.3% | 449.05 | 319.4/km2 |
| L'Île-Cadieux | Vaudreuil-Soulanges | 126 | 105 | +20.0% | 0.59 | 213.6/km2 | |
| L'Île-d'Anticosti | Municipality | Minganie | 218 | 240 | −9.2% | 7,953.20 | 0.0/km2 |
| L'Île-Dorval | Town | Montréal | 5 | 5 | 0.0% | 0.19 | 26.3/km2 |
| L'Île-du-Grand-Calumet | Municipality | Pontiac | 626 | 731 | −14.4% | 132.57 | 4.7/km2 |
| L'Île-Perrot | Town | Vaudreuil-Soulanges | 10,756 | 10,503 | +2.4% | 5.55 | 1,938.0/km2 |
| Lingwick | Township | Le Haut-Saint-François | 428 | 399 | +7.3% | 243.48 | 1.8/km2 |
| L'Isle-aux-Allumettes | Municipality | Pontiac | 1,334 | 1,345 | −0.8% | 186.02 | 7.2/km2 |
| L'Isle-aux-Coudres | Charlevoix | 1,143 | 1,279 | −10.6% | 30.16 | 37.9/km2 | |
| L'Isle-Verte | Rivière-du-Loup | 1,294 | 1,469 | −11.9% | 117.63 | 11.0/km2 | |
| L'Islet | L'Islet | 3,827 | 3,999 | −4.3% | 120.2 | 31.8/km2 | |
| Litchfield | Pontiac | 459 | 456 | +0.7% | 202.18 | 2.3/km2 | |
| Lochaber | Township | Papineau | 415 | 409 | +1.5% | 60.70 | 6.8/km2 |
| Lochaber-Partie-Ouest | 856 | 646 | +32.5% | 57.45 | 14.9/km2 | ||
| Longue-Pointe-de-Mingan | Municipality | Minganie | 434 | 479 | −9.4% | 387.81 | 1.1/km2 |
| Longue-Rive | La Haute-Côte-Nord | 1,026 | 1,113 | −7.8% | 312.77 | 3.3/km2 | |
| Longueuil | Town | Longueuil | 239,700 | 231,409 | +3.6% | 115.75 | 2,070.8/km2 |
| Lorraine | Thérèse-De Blainville | 9,352 | 9,479 | −1.3% | 5.92 | 1,579.7/km2 | |
| Lorrainville | Municipality | Témiscamingue | 1,272 | 1,328 | −4.2% | 87.94 | 14.5/km2 |
| Lotbinière | Lotbinière | 812 | 887 | −8.5% | 79.94 | 10.2/km2 | |
| Louiseville | Town | Maskinongé | 7,152 | 7,517 | −4.9% | 63.85 | 112.0/km2 |
| Low | Township | La Vallée-de-la-Gatineau | 982 | 920 | +6.7% | 261.17 | 3.8/km2 |
| Lyster | Municipality | L'Érable | 1,605 | 1,628 | −1.4% | 167.57 | 9.6/km2 |
| Macamic | Town | Abitibi-Ouest | 2,751 | 2,734 | +0.6% | 202.70 | 13.6/km2 |
| Maddington Falls | Municipality | Arthabaska | 413 | 443 | −6.8% | 23.84 | 17.3/km2 |
| Magog | Town | Memphrémagog | 26,669 | 25,692 | +3.8% | 144.47 | 184.6/km2 |
| Malartic | La Vallée-de-l'Or | 3,377 | 3,449 | −2.1% | 148.85 | 22.7/km2 | |
| Mandeville | Municipality | D'Autray | 2,189 | 2,043 | +7.1% | 322.73 | 6.8/km2 |
| Maniwaki | Town | La Vallée-de-la-Gatineau | 3,853 | 3,930 | −2.0% | 5.98 | 644.3/km2 |
| Manseau | Municipality | Bécancour | 816 | 843 | −3.2% | 104.64 | 7.8/km2 |
| Mansfield-et-Pontefract | Pontiac | 2,285 | 2,204 | +3.7% | 477.44 | 4.8/km2 | |
| Maria | Avignon | 2,615 | 2,536 | +3.1% | 95.09 | 27.5/km2 | |
| Maricourt | Le Val-Saint-François | 416 | 497 | −16.3% | 61.16 | 6.8/km2 | |
| Marieville | Town | Rouville | 10,725 | 10,094 | +6.3% | 63.23 | 169.6/km2 |
| Marsoui | Village | La Haute-Gaspésie | 275 | 309 | −11.0% | 181.75 | 1.5/km2 |
| Marston | Township | Le Granit | 705 | 662 | +6.5% | 71.91 | 9.8/km2 |
| Martinville | Municipality | Coaticook | 436 | 469 | −7.0% | 47.69 | 9.1/km2 |
| Mascouche | Town | Les Moulins | 46,692 | 42,491 | +9.9% | 107.00 | 436.4/km2 |
| Maskinongé | Municipality | Maskinongé | 2,319 | 2,253 | +2.9% | 73.10 | 31.7/km2 |
| Massueville | Village | Pierre-De Saurel | 529 | 516 | +2.5% | 1.55 | 341.3/km2 |
| Matagami | Town | Jamésie | 1,453 | 1,526 | −4.8% | 75.03 | 19.4/km2 |
| Matane | La Matanie | 14,311 | 14,462 | −1.0% | 196.08 | 73.0/km2 | |
| Matapédia | Municipality | Avignon | 645 | 664 | −2.9% | 71.55 | 9.0/km2 |
| Mayo | Papineau | 601 | 572 | +5.1% | 73.25 | 8.2/km2 | |
| McMasterville | La Vallée-du-Richelieu | 5,698 | 5,615 | +1.5% | 3.12 | 1,826.3/km2 | |
| Melbourne | Township | Le Val-Saint-François | 1,063 | 979 | +8.6% | 174.06 | 6.1/km2 |
| Mercier | Town | Roussillon | 13,115 | 11,584 | +13.2% | 46.08 | 284.6/km2 |
| Messines | Municipality | La Vallée-de-la-Gatineau | 1,609 | 1,608 | +0.1% | 111.97 | 14.4/km2 |
| Métabetchouan–Lac-à-la-Croix | Town | Lac-Saint-Jean-Est | 3,985 | 4,097 | −2.7% | 187.23 | 21.3/km2 |
| Métis-sur-Mer | La Mitis | 572[6] | 607 | −5.8% | 48.60 | 11.8/km2 | |
| Milan | Municipality | Le Granit | 299 | 270 | +10.7% | 129.52 | 2.3/km2 |
| Mille-Isles | Argenteuil | 1,567 | 1,629 | −3.8% | 59.82 | 26.2/km2 | |
| Mirabel | Town | Mirabel | 50,513 | 41,957 | +20.4% | 485.07 | 104.1/km2 |
| Moffet | Municipality | Témiscamingue | 187 | 196 | −4.6% | 343.00 | 0.5/km2 |
| Mont-Blanc | Les Laurentides | 3,499 | 3,467 | +0.9% | 121.53 | 28.8/km2 | |
| Mont-Carmel | Kamouraska | 1,127 | 1,136 | −0.8% | 429.03 | 2.6/km2 | |
| Mont-Joli | Town | La Mitis | 6,281 | 6,665 | −5.8% | 24.20 | 259.5/km2 |
| Mont-Laurier | Antoine-Labelle | 14,116 | 13,779 | +2.4% | 591.27 | 23.9/km2 | |
| Mont-Royal | Montréal | 20,276 | 19,503 | +4.0% | 7.53 | 2,692.7/km2 | |
| Mont-Saint-Grégoire | Municipality | Le Haut-Richelieu | 3,077 | 3,086 | −0.3% | 79.97 | 38.5/km2 |
| Mont-Saint-Hilaire | Town | La Vallée-du-Richelieu | 18,585 | 18,200 | +2.1% | 44.19 | 420.6/km2 |
| Mont-Saint-Michel | Municipality | Antoine-Labelle | 503 | 633 | −20.5% | 139.02 | 3.6/km2 |
| Mont-Saint-Pierre | Village | La Haute-Gaspésie | 155 | 192 | −19.3% | 52.39 | 3.0/km2 |
| Mont-Tremblant | Town | Les Laurentides | 9,646 | 9,494 | +1.6% | 235.06 | 41.0/km2 |
| Montcalm | Municipality | 628 | 619 | +1.5% | 119.98 | 5.2/km2 | |
| Montcerf-Lytton | La Vallée-de-la-Gatineau | 636 | 687 | −7.4% | 360.05 | 1.8/km2 | |
| Montebello | Papineau | 983 | 978 | +0.5% | 8.62 | 114.0/km2 | |
| Montmagny | Town | Montmagny | 11,255 | 11,491 | −2.1% | 124.51 | 90.4/km2 |
| Montpellier | Municipality | Papineau | 985 | 986 | −0.1% | 249.14 | 4.0/km2 |
| Montreal | Town | Montréal | 1,704,694 | 1,649,519 | +3.3% | 365.65 | 4,662.1/km2 |
| Montréal-Est | 3,850 | 3,728 | +3.3% | 12.24 | 314.5/km2 | ||
| Montreal-Ouest | 5,050 | 5,085 | −0.7% | 1.37 | 3,686.1/km2 | ||
| Morin-Heights | Municipality | Les Pays-d'en-Haut | 4,145 | 3,925 | +5.6% | 56.66 | 73.2/km2 |
| Mulgrave-et-Derry | Papineau | 369 | 366 | +0.8% | 293.75 | 1.3/km2 | |
| Murdochville | Town | La Côte-de-Gaspé | 651 | 764 | −14.8% | 61.37 | 10.6/km2 |
| Namur | Municipality | Papineau | 572 | 596 | −4.0% | 56.76 | 10.1/km2 |
| Nantes | Le Granit | 1,377 | 1,374 | +0.2% | 119.30 | 11.5/km2 | |
| Napierville | Les Jardins-de-Napierville | 3,899 | 3,525 | +10.6% | 4.37 | 892.2/km2 | |
| Natashquan | Minganie | 263 | 277 | −5.1% | 197.60 | 1.3/km2 | |
| Nédélec | Township | Témiscamingue | 356 | 403 | −11.7% | 374.10 | 1.0/km2 |
| Neuville | Town | Portneuf | 4,392 | 3,888 | +13.0% | 71.99 | 61.0/km2 |
| New Carlisle | Municipality | Bonaventure | 1,388 | 1,358 | +2.2% | 67.77 | 20.5/km2 |
| New Richmond | Town | 3,706 | 3,810 | −2.7% | 171.34 | 21.6/km2 | |
| Newport | Municipality | Le Haut-Saint-François | 733 | 720 | +1.8% | 271.12 | 2.7/km2 |
| Nicolet | Town | Nicolet-Yamaska | 8,169 | 7,828 | +4.4% | 95.93 | 85.2/km2 |
| Nominingue | Municipality | Antoine-Labelle | 2,137 | 2,019 | +5.8% | 307.48 | 7.0/km2 |
| Normandin | Town | Maria-Chapdelaine | 3,033 | 3,137 | −3.3% | 212.46 | 14.3/km2 |
| Normétal | Municipality | Abitibi-Ouest | 808 | 856 | −5.6% | 55.68 | 14.5/km2 |
| North Hatley | Village | Memphrémagog | 632 | 654 | −3.4% | 3.35 | 188.7/km2 |
| Notre-Dame-Auxiliatrice-de-Buckland | Parish | Bellechasse | 768 | 785 | −2.2% | 94.95 | 8.1/km2 |
| Notre-Dame-de-Bonsecours | Municipality | Papineau | 301 | 261 | +15.3% | 264.97 | 1.1/km2 |
| Notre-Dame-de-Ham | Arthabaska | 411 | 414 | −0.7% | 32.30 | 12.7/km2 | |
| Notre-Dame-de-la-Merci | Matawinie | 905 | 978 | −7.5% | 249.92 | 3.6/km2 | |
| Notre-Dame-de-la-Paix | Papineau | 648 | 718 | −9.7% | 106.62 | 6.1/km2 | |
| Notre-Dame-de-la-Salette | Les Collines-de-l'Outaouais | 727 | 757 | −4.0% | 115.49 | 6.3/km2 | |
| Notre-Dame-de-l'Île-Perrot | Town | Vaudreuil-Soulanges | 10,654 | 10,620 | +0.3% | 28.21 | 377.7/km2 |
| Notre-Dame-de-Lorette | Municipality | Maria-Chapdelaine | 189 | 189 | 0.0% | 335.82 | 0.6/km2 |
| Notre-Dame-de-Lourdes | Joliette | 2,783 | 2,595 | +7.2% | 35.84 | 77.7/km2 | |
| Notre-Dame-de-Lourdes | Parish | L'Érable | 688 | 700 | −1.7% | 81.81 | 8.4/km2 |
| Notre-Dame-de-Montauban | Municipality | Mékinac | 745 | 747 | −0.3% | 163.69 | 4.6/km2 |
| Notre-Dame-de-Pontmain | Antoine-Labelle | 782 | 720 | +8.6% | 263.48 | 3.0/km2 | |
| Notre-Dame-de-Stanbridge | Brome-Missisquoi | 668 | 660 | +1.2% | 43.90 | 15.2/km2 | |
| Notre-Dame-des-Anges | Parish | Québec | 318 | 394 | −19.3% | 0.04 | 7,950.0/km2 |
| Notre-Dame-des-Bois | Municipality | Le Granit | 938 | 911 | +3.0% | 192.75 | 4.9/km2 |
| Notre-Dame-des-Monts | Charlevoix-Est | 791 | 815 | −2.9% | 57.44 | 13.8/km2 | |
| Notre-Dame-des-Neiges | Les Basques | 1,085 | 1,129 | −3.9% | 94.21 | 11.5/km2 | |
| Notre-Dame-des-Pins | Parish | Beauce-Sartigan | 1,594 | 1,227 | +29.9% | 24.12 | 66.1/km2 |
| Notre-Dame-des-Prairies | Town | Joliette | 9,273 | 8,868 | +4.6% | 18.20 | 509.5/km2 |
| Notre-Dame-des-Sept-Douleurs | Parish | Rivière-du-Loup | 36 | 49 | −26.5% | 11.71 | 3.1/km2 |
| Notre-Dame-du-Bon-Conseil | Drummond | 949 | 979 | −3.1% | 87.55 | 10.8/km2 | |
| Notre-Dame-du-Bon-Conseil | Village | 1,557 | 1,404 | +10.9% | 4.20 | 370.7/km2 | |
| Notre-Dame-du-Laus | Municipality | Antoine-Labelle | 1,558 | 1,518 | +2.6% | 862.08 | 1.8/km2 |
| Notre-Dame-du-Mont-Carmel | Parish | Les Chenaux | 5,751 | 5,467 | +5.2% | 128.54 | 44.7/km2 |
| Notre-Dame-du-Nord | Municipality | Témiscamingue | 1,052 | 1,075 | −2.1% | 74.76 | 14.1/km2 |
| Notre-Dame-du-Portage | Rivière-du-Loup | 1,151 | 1,193 | −3.5% | 40.29 | 28.6/km2 | |
| Notre-Dame-du-Rosaire | Montmagny | 392 | 384 | +2.1% | 164.76 | 2.4/km2 | |
| Notre-Dame-du-Sacré-Cœur-d'Issoudun | Parish | Lotbinière | 861 | 869 | −0.9% | 60.33 | 14.3/km2 |
| Nouvelle | Municipality | Avignon | 1,681[6] | 1,689 | −0.5% | 232.43 | 7.2/km2 |
| Noyan | Le Haut-Richelieu | 1,392 | 1,297 | +7.3% | 44.30 | 31.4/km2 | |
| Ogden | Memphrémagog | 741 | 770 | −3.8% | 74.80 | 9.9/km2 | |
| Oka | Deux-Montagnes | 3,824 | 3,969 | −3.7% | 57.31 | 66.7/km2 | |
| Orford | Township | Memphrémagog | 4,337 | 3,575 | +21.3% | 136.19 | 31.8/km2 |
| Ormstown | Municipality | Le Haut-Saint-Laurent | 3,595 | 3,595 | 0.0% | 142.79 | 25.2/km2 |
| Otter Lake | Pontiac | 932 | 1,109 | −16.0% | 463.01 | 2.0/km2 | |
| Otterburn Park | Town | La Vallée-du-Richelieu | 8,421 | 8,450 | −0.3% | 5.37 | 1,568.2/km2 |
| Packington | Parish | Témiscouata | 603 | 595 | +1.3% | 118.88 | 5.1/km2 |
| Padoue | Municipality | La Mitis | 245 | 273 | −10.3% | 66.73 | 3.7/km2 |
| Palmarolle | Abitibi-Ouest | 1,409 | 1,465 | −3.8% | 117.98 | 11.9/km2 | |
| Papineauville | Papineau | 2,101 | 2,165 | −3.0% | 61.33 | 34.3/km2 | |
| Parisville | Parish | Bécancour | 530 | 528 | +0.4% | 35.54 | 14.9/km2 |
| Paspébiac | Town | Bonaventure | 3,164 | 3,198 | −1.1% | 94.47 | 33.5/km2 |
| Percé | Le Rocher-Percé | 3,103 | 3,312 | −6.3% | 431.37 | 7.2/km2 | |
| Péribonka | Municipality | Maria-Chapdelaine | 515 | 464 | +11.0% | 111.33 | 4.6/km2 |
| Petit-Saguenay | Le Fjord-du-Saguenay | 634 | 727 | −12.8% | 334.57 | 1.9/km2 | |
| Petite-Rivière-Saint-François | Charlevoix | 814 | 744 | +9.4% | 134.31 | 6.1/km2 | |
| Petite-Vallée | La Côte-de-Gaspé | 170 | 178 | −4.5% | 39.94 | 4.3/km2 | |
| Piedmont | Les Pays-d'en-Haut | 2,950 | 2,721 | +8.4% | 24.56 | 120.1/km2 | |
| Pierreville | Nicolet-Yamaska | 2,143 | 2,176 | −1.5% | 78.63 | 27.3/km2 | |
| Pike River | Brome-Missisquoi | 517 | 525 | −1.5% | 40.81 | 12.7/km2 | |
| Pincourt | Town | Vaudreuil-Soulanges | 14,558 | 14,305 | +1.8% | 7.11 | 2,047.5/km2 |
| Piopolis | Municipality | Le Granit | 358 | 364 | −1.6% | 103.17 | 3.5/km2 |
| Plaisance | Papineau | 1,088 | 1,103 | −1.4% | 36.15 | 30.1/km2 | |
| Plessisville | Parish | L'Érable | 2,663 | 2,678 | −0.6% | 141.50 | 18.8/km2 |
| Plessisville | Town | 6,551 | 6,688 | −2.0% | 4.40 | 1,488.9/km2 | |
| Pohénégamook | Témiscouata | 2,582 | 2,770 | −6.8% | 340.44 | 7.6/km2 | |
| Pointe-à-la-Croix | Municipality | Avignon | 1,408[6] | 1,457 | −3.4% | 390.96 | 3.6/km2 |
| Pointe-aux-Outardes | Village | Manicouagan | 1,332 | 1,330 | +0.2% | 76.42 | 17.4/km2 |
| Pointe-Calumet | Municipality | Deux-Montagnes | 6,428 | 6,396 | +0.5% | 4.62 | 1,391.3/km2 |
| Pointe-Claire | Town | Montréal | 31,380 | 30,790 | +1.9% | 18.90 | 1,660.3/km2 |
| Pointe-des-Cascades | Village | Vaudreuil-Soulanges | 1,481 | 1,340 | +10.5% | 2.68 | 552.6/km2 |
| Pointe-Fortune | 580 | 542 | +7.0% | 8.26 | 70.2/km2 | ||
| Pointe-Lebel | Manicouagan | 1,918 | 1,973 | −2.8% | 85.17 | 22.5/km2 | |
| Pontiac | Municipality | Les Collines-de-l'Outaouais | 5,850 | 5,681 | +3.0% | 448.15 | 13.1/km2 |
| Pont-Rouge | Town | Portneuf | 9,240 | 8,723 | +5.9% | 121.20 | 76.2/km2 |
| Port-Cartier | Sept-Rivières | 6,799 | 6,651 | +2.2% | 1,102.09 | 6.2/km2 | |
| Port-Daniel–Gascons | Municipality | Le Rocher-Percé | 2,210 | 2,453 | −9.9% | 301.60 | 7.3/km2 |
| Portage-du-Fort | Village | Pontiac | 234 | 266 | −12.0% | 4.23 | 55.3/km2 |
| Portneuf | Town | Portneuf | 3,187 | 3,107 | +2.6% | 109.39 | 29.1/km2 |
| Portneuf-sur-Mer | Municipality | La Haute-Côte-Nord | 598 | 761 | −21.4% | 183.60 | 3.3/km2 |
| Potton | Township | Memphrémagog | 1,852 | 1,849 | +0.2% | 260.96 | 7.1/km2 |
| Poularies | Municipality | Abitibi-Ouest | 682 | 679 | +0.4% | 170.07 | 4.0/km2 |
| Preissac | Abitibi | 835 | 786 | +6.2% | 428.26 | 1.9/km2 | |
| Prévost | Town | La Rivière-du-Nord | 13,002 | 12,171 | +6.8% | 34.58 | 376.0/km2 |
| Price | Village | La Mitis | 1,759 | 1,673 | +5.1% | 2.58 | 681.8/km2 |
| Princeville | Town | L'Érable | 6,001 | 5,693 | +5.4% | 195.26 | 30.7/km2 |
| Quebec City | Québec | 531,902 | 516,576 | +3.0% | 453.38 | 1,173.2/km2 | |
| Racine | Municipality | Le Val-Saint-François | 1,323 | 1,252 | +5.7% | 105.82 | 12.5/km2 |
| Ragueneau | Parish | Manicouagan | 1,343 | 1,405 | −4.4% | 185.55 | 7.2/km2 |
| Rapide-Danseur | Municipality | Abitibi-Ouest | 328 | 312 | +5.1% | 175.56 | 1.9/km2 |
| Rapides-des-Joachims | Pontiac | 156 | 167 | −6.6% | 242.81 | 0.6/km2 | |
| Rawdon | Matawinie | 11,057 | 10,416 | +6.2% | 186.27 | 59.4/km2 | |
| Rémigny | Témiscamingue | 280 | 279 | +0.4% | 896.26 | 0.3/km2 | |
| Repentigny | Town | L'Assomption | 84,285 | 82,000 | +2.8% | 61.23 | 1,376.5/km2 |
| Richelieu | Rouville | 5,236 | 5,467 | −4.2% | 30.98 | 169.0/km2 | |
| Richmond | Le Val-Saint-François | 3,232 | 3,275 | −1.3% | 6.92 | 467.1/km2 | |
| Rigaud | Vaudreuil-Soulanges | 7,777 | 7,346 | +5.9% | 99.23 | 78.4/km2 | |
| Rimouski | Rimouski-Neigette | 48,664 | 46,860 | +3.8% | 339.64 | 143.3/km2 | |
| Ripon | Municipality | Papineau | 1,542 | 1,522 | +1.3% | 131.47 | 11.7/km2 |
| Ristigouche-Partie-Sud-Est | Township | Avignon | 171 | 167 | +2.4% | 51.70 | 3.3/km2 |
| Rivière-à-Claude | Municipality | La Haute-Gaspésie | 128 | 130 | −1.5% | 156.28 | 0.8/km2 |
| Rivière-à-Pierre | Portneuf | 584 | 671 | −13.0% | 522.47 | 1.1/km2 | |
| Rivière-au-Tonnerre | Minganie | 279 | 307 | −9.1% | 619.24 | 0.5/km2 | |
| Rivière-Beaudette | Vaudreuil-Soulanges | 2,097 | 1,885 | +11.2% | 18.68 | 112.3/km2 | |
| Rivière-Bleue | Témiscouata | 1,230 | 1,299 | −5.3% | 173.59 | 7.1/km2 | |
| Rivière-du-Loup | Town | Rivière-du-Loup | 19,507 | 19,447 | +0.3% | 84.11 | 231.9/km2 |
| Rivière-Éternité | Municipality | Le Fjord-du-Saguenay | 413 | 484 | −14.7% | 474.52 | 0.9/km2 |
| Rivière-Héva | La Vallée-de-l'Or | 1,419 | 1,433 | −1.0% | 426.17 | 3.3/km2 | |
| Rivière-Ouelle | Kamouraska | 970 | 1,058 | −8.3% | 57.78 | 16.8/km2 | |
| Rivière-Rouge | Town | Antoine-Labelle | 4,322 | 4,645 | −7.0% | 455.65 | 9.5/km2 |
| Rivière-Saint-Jean | Municipality | Minganie | 215 | 239 | −10.0% | 522.92 | 0.4/km2 |
| Roberval | Town | Le Domaine-du-Roy | 10,046 | 10,227 | −1.8% | 151.85 | 66.2/km2 |
| Rochebaucourt | Municipality | Abitibi | 131 | 161 | −18.6% | 184.95 | 0.7/km2 |
| Roquemaure | Abitibi-Ouest | 395 | 414 | −4.6% | 120.86 | 3.3/km2 | |
| Rosemère | Town | Thérèse-De Blainville | 13,958 | 14,294 | −2.4% | 10.84 | 1,287.6/km2 |
| Rougemont | Municipality | Rouville | 2,755 | 2,723 | +1.2% | 43.92 | 62.7/km2 |
| Rouyn-Noranda | Town | Rouyn-Noranda | 42,334 | 41,012 | +3.2% | 6,009.86 | 7.0/km2 |
| Roxton | Township | Acton | 1,086 | 1,093 | −0.6% | 149.00 | 7.3/km2 |
| Roxton Falls | Village | 1,305 | 1,265 | +3.2% | 4.93 | 264.7/km2 | |
| Roxton Pond | Municipality | La Haute-Yamaska | 3,809 | 3,786 | +0.6% | 97.78 | 39.0/km2 |
| Sacré-Cœur | La Haute-Côte-Nord | 1,803 | 1,881 | −4.1% | 307.99 | 5.9/km2 | |
| Sacré-Cœur-de-Jésus | Parish | Les Appalaches | 521 | 564 | −7.6% | 104.64 | 5.0/km2 |
| Saguenay | Town | Saguenay | 145,949 | 144,746 | +0.8% | 1,128.56 | 129.3/km2 |
| Saint-Adalbert | Municipality | L'Islet | 510 | 536 | −4.9% | 217.41 | 2.3/km2 |
| Saint-Adelme | Parish | La Matanie | 520[6] | 485 | +7.2% | 100.64 | 5.2/km2 |
| Saint-Adelphe | Mékinac | 922 | 952 | −3.2% | 137.45 | 6.7/km2 | |
| Saint-Adolphe-d'Howard | Municipality | Les Pays-d'en-Haut | 3,509 | 3,702 | −5.2% | 138.18 | 25.4/km2 |
| Saint-Adrien | Les Sources | 522 | 490 | +6.5% | 98.71 | 5.3/km2 | |
| Saint-Adrien-d'Irlande | Les Appalaches | 399 | 389 | +2.6% | 53.19 | 7.5/km2 | |
| Saint-Agapit | Lotbinière | 4,280 | 3,567 | +20.0% | 65.44 | 65.4/km2 | |
| Saint-Aimé | Pierre-De Saurel | 461 | 505 | −8.7% | 60.57 | 7.6/km2 | |
| Saint-Aimé-des-Lacs | Charlevoix-Est | 1,095 | 1,073 | +2.1% | 92.00 | 11.9/km2 | |
| Saint-Aimé-du-Lac-des-Îles | Antoine-Labelle | 790 | 778 | +1.5% | 163.74 | 4.8/km2 | |
| Saint-Alban | Portneuf | 1,198 | 1,225 | −2.2% | 149.04 | 8.0/km2 | |
| Saint-Albert | Arthabaska | 1,601 | 1,526 | +4.9% | 69.49 | 23.0/km2 | |
| Saint-Alexandre | Le Haut-Richelieu | 2,469 | 2,495 | −1.0% | 76.45 | 32.3/km2 | |
| Saint-Alexandre-de-Kamouraska | Kamouraska | 2,109 | 2,050 | +2.9% | 111.31 | 18.9/km2 | |
| Saint-Alexandre-des-Lacs | Parish | La Matapédia | 268[6] | 258 | +3.9% | 90.07 | 3.0/km2 |
| Saint-Alexis | Municipality | Montcalm | 1,308 | 1,367 | −4.3% | 43.02 | 30.4/km2 |
| Saint-Alexis-de-Matapédia | Avignon | 500 | 548 | −8.8% | 84.09 | 5.9/km2 | |
| Saint-Alexis-des-Monts | Parish | Maskinongé | 2,981 | 3,046 | −2.1% | 1,048.39 | 2.8/km2 |
| Saint-Alfred | Municipality | Robert-Cliche | 492 | 485 | +1.4% | 43.52 | 11.3/km2 |
| Saint-Alphonse | Bonaventure | 699 | 691 | +1.2% | 112.07 | 6.2/km2 | |
| Saint-Alphonse-de-Granby | La Haute-Yamaska | 3,094 | 3,125 | −1.0% | 50.14 | 61.7/km2 | |
| Saint-Alphonse-Rodriguez | Matawinie | 3,162 | 3,134 | +0.9% | 97.78 | 32.3/km2 | |
| Saint-Amable | Town | Marguerite-D'Youville | 12,167 | 10,930 | +11.3% | 36.81 | 330.5/km2 |
| Saint-Ambroise | Municipality | Le Fjord-du-Saguenay | 3,781 | 3,546 | +6.6% | 149.83 | 25.2/km2 |
| Saint-Ambroise-de-Kildare | Joliette | 3,856 | 3,747 | +2.9% | 67.72 | 56.9/km2 | |
| Saint-Anaclet-de-Lessard | Parish | Rimouski-Neigette | 3,071 | 3,035 | +1.2% | 126.77 | 24.2/km2 |
| Saint-André-Avellin | Municipality | Papineau | 3,749 | 3,702 | +1.3% | 137.99 | 27.2/km2 |
| Saint-André-d'Argenteuil | Argenteuil | 3,020 | 3,275 | −7.8% | 97.80 | 30.9/km2 | |
| Saint-André-de-Kamouraska | Kamouraska | 658 | 651 | +1.1% | 70.65 | 9.3/km2 | |
| Saint-André-de-Restigouche | Avignon | 161 | 157 | +2.5% | 144.54 | 1.1/km2 | |
| Saint-André-du-Lac-Saint-Jean | Village | Le Domaine-du-Roy | 467 | 488 | −4.3% | 145.56 | 3.2/km2 |
| Saint-Anicet | Municipality | Le Haut-Saint-Laurent | 2,626 | 2,523 | +4.1% | 135.33 | 19.4/km2 |
| Saint-Anselme | Bellechasse | 3,938 | 3,458 | +13.9% | 74.27 | 53.0/km2 | |
| Saint-Antoine-de-l'Isle-aux-Grues | Parish | Montmagny | 144 | 146 | −1.4% | 25.43 | 5.7/km2 |
| Saint-Antoine-de-Tilly | Municipality | Lotbinière | 1,598 | 1,604 | −0.4% | 60.20 | 26.5/km2 |
| Saint-Antoine-sur-Richelieu | La Vallée-du-Richelieu | 1,694 | 1,659 | +2.1% | 65.74 | 25.8/km2 | |
| Saint-Antonin | Town | Rivière-du-Loup | 4,049 | 4,027 | +0.5% | 176.09 | 23.0/km2 |
| Saint-Apollinaire | Municipality | Lotbinière | 6,110 | 5,102 | +19.8% | 96.95 | 63.0/km2 |
| Saint-Armand | Brome-Missisquoi | 1,205 | 1,248 | −3.4% | 83.21 | 14.5/km2 | |
| Saint-Arsène | Parish | Rivière-du-Loup | 1,230 | 1,253 | −1.8% | 70.94 | 17.3/km2 |
| Saint-Athanase | Municipality | Témiscouata | 317 | 301 | +5.3% | 292.89 | 1.1/km2 |
| Saint-Aubert | L'Islet | 1,474 | 1,409 | +4.6% | 98.59 | 15.0/km2 | |
| Saint-Augustin | Le Golfe-du-Saint-Laurent | 445 | 478 | −6.9% | 1,252.77 | 0.4/km2 | |
| Saint-Augustin | Parish | Maria-Chapdelaine | 351 | 400 | −12.3% | 104.56 | 3.4/km2 |
| Saint-Augustin-de-Desmaures | Town | Québec | 18,820 | 18,141 | +3.7% | 85.87 | 219.2/km2 |
| Saint-Augustin-de-Woburn | Parish | Le Granit | 692 | 695 | −0.4% | 281.40 | 2.5/km2 |
| Saint-Barnabé | Maskinongé | 1,196 | 1,179 | +1.4% | 58.83 | 20.3/km2 | |
| Saint-Barnabé-Sud | Municipality | Les Maskoutains | 861 | 859 | +0.2% | 57.22 | 15.0/km2 |
| Saint-Barthélemy | Parish | D'Autray | 1,934 | 1,883 | +2.7% | 105.70 | 18.3/km2 |
| Saint-Basile | Town | Portneuf | 2,631 | 2,463 | +6.8% | 98.84 | 26.6/km2 |
| Saint-Basile-le-Grand | La Vallée-du-Richelieu | 17,059 | 16,736 | +1.9% | 35.89 | 475.3/km2 | |
| Saint-Benjamin | Municipality | Les Etchemins | 987 | 891 | +10.8% | 111.57 | 8.8/km2 |
| Saint-Benoît-du-Lac | Memphrémagog | 32 | 50 | −36.0% | 2.18 | 14.7/km2 | |
| Saint-Benoît-Labre | Beauce-Sartigan | 1,630 | 1,612 | +1.1% | 85.64 | 19.0/km2 | |
| Saint-Bernard | La Nouvelle-Beauce | 2,321 | 2,021 | +14.8% | 90.15 | 25.7/km2 | |
| Saint-Bernard-de-Lacolle | Les Jardins-de-Napierville | 1,549 | 1,477 | +4.9% | 113.52 | 13.6/km2 | |
| Saint-Bernard-de-Michaudville | Les Maskoutains | 586 | 521 | +12.5% | 66.05 | 8.9/km2 | |
| Saint-Blaise-sur-Richelieu | Le Haut-Richelieu | 2,066 | 1,837 | +12.5% | 69.64 | 29.7/km2 | |
| Saint-Bonaventure | Drummond | 1,031 | 1,017 | +1.4% | 78.81 | 13.1/km2 | |
| Saint-Boniface | Maskinongé | 4,832 | 4,429 | +9.1% | 108.54 | 44.5/km2 | |
| Saint-Bruno | Lac-Saint-Jean-Est | 2,801 | 2,636 | +6.3% | 78.07 | 35.9/km2 | |
| Saint-Bruno-de-Guigues | Témiscamingue | 1,154 | 1,100 | +4.9% | 125.70 | 9.2/km2 | |
| Saint-Bruno-de-Kamouraska | Kamouraska | 541 | 534 | +1.3% | 188.96 | 2.9/km2 | |
| Saint-Bruno-de-Montarville | Town | Longueuil | 26,394 | 26,107 | +1.1% | 43.14 | 611.8/km2 |
| Saint-Calixte | Municipality | Montcalm | 6,046 | 5,934 | +1.9% | 143.63 | 42.1/km2 |
| Saint-Camille | Township | Les Sources | 529 | 511 | +3.5% | 83.09 | 6.4/km2 |
| Saint-Camille-de-Lellis | Parish | Les Etchemins | 752 | 844 | −10.9% | 251.92 | 3.0/km2 |
| Saint-Casimir | Municipality | Portneuf | 1,430 | 1,500 | −4.7% | 66.55 | 21.5/km2 |
| Saint-Célestin | Nicolet-Yamaska | 575 | 611 | −5.9% | 77.13 | 7.5/km2 | |
| Saint-Célestin | Village | 831 | 781 | +6.4% | 1.41 | 589.4/km2 | |
| Saint-Césaire | Town | Rouville | 5,877 | 5,686 | +3.4% | 83.20 | 70.6/km2 |
| Saint-Charles-Borromée | Joliette | 13,791 | 13,321 | +3.5% | 18.52 | 744.7/km2 | |
| Saint-Charles-de-Bellechasse | Municipality | Bellechasse | 2,396 | 2,246 | +6.7% | 93.34 | 25.7/km2 |
| Saint-Charles-de-Bourget | Le Fjord-du-Saguenay | 736 | 690 | +6.7% | 62.03 | 11.9/km2 | |
| Saint-Charles-Garnier | Parish | La Mitis | 240 | 271 | −11.4% | 84.77 | 2.8/km2 |
| Saint-Charles-sur-Richelieu | Municipality | La Vallée-du-Richelieu | 1,717 | 1,643 | +4.5% | 65.00 | 26.4/km2 |
| Saint-Christophe-d'Arthabaska | Parish | Arthabaska | 3,021 | 2,892 | +4.5% | 69.00 | 43.8/km2 |
| Saint-Chrysostome | Municipality | Le Haut-Saint-Laurent | 2,645 | 2,522 | +4.9% | 100.40 | 26.3/km2 |
| Saint-Claude | Le Val-Saint-François | 1,185 | 1,106 | +7.1% | 119.08 | 10.0/km2 | |
| Saint-Clément | Les Basques | 460 | 499 | −7.8% | 86.84 | 5.3/km2 | |
| Saint-Cléophas | Parish | La Matapédia | 333 | 334 | −0.3% | 97.44 | 3.4/km2 |
| Saint-Cléophas-de-Brandon | Municipality | D'Autray | 227 | 276 | −17.8% | 15.34 | 14.8/km2 |
| Saint-Clet | Vaudreuil-Soulanges | 1,779 | 1,738 | +2.4% | 39.32 | 45.2/km2 | |
| Saint-Colomban | Town | La Rivière-du-Nord | 16,019 | 13,080 | +22.5% | 93.87 | 170.7/km2 |
| Saint-Côme | Municipality | Matawinie | 2,193 | 2,198 | −0.2% | 165.18 | 13.3/km2 |
| Saint-Côme–Linière | Beauce-Sartigan | 3,239 | 3,274 | −1.1% | 150.67 | 21.5/km2 | |
| Saint-Constant | Town | Roussillon | 27,359 | 24,980 | +9.5% | 57.13 | 478.9/km2 |
| Saint-Cuthbert | Municipality | D'Autray | 1,862 | 1,839 | +1.3% | 132.28 | 14.1/km2 |
| Saint-Cyprien | Rivière-du-Loup | 1,066 | 1,163 | −8.3% | 138.16 | 7.7/km2 | |
| Saint-Cyprien | Parish | Les Etchemins | 490 | 548 | −10.6% | 93.52 | 5.2/km2 |
| Saint-Cyprien-de-Napierville | Municipality | Les Jardins-de-Napierville | 1,927 | 1,869 | +3.1% | 97.45 | 19.8/km2 |
| Saint-Cyrille-de-Lessard | Parish | L'Islet | 718 | 753 | −4.6% | 230.79 | 3.1/km2 |
| Saint-Cyrille-de-Wendover | Municipality | Drummond | 4,723 | 4,389 | +7.6% | 110.39 | 42.8/km2 |
| Saint-Damase | Les Maskoutains | 2,473 | 2,506 | −1.3% | 79.70 | 31.0/km2 | |
| Saint-Damase | Parish | La Matapédia | 356[6] | 397 | −10.3% | 116.69 | 3.1/km2 |
| Saint-Damase-de-L'Islet | Municipality | L'Islet | 552 | 591 | −6.6% | 247.71 | 2.2/km2 |
| Saint-Damien | Parish | Matawinie | 2,094 | 2,020 | +3.7% | 255.87 | 8.2/km2 |
| Saint-Damien-de-Buckland | Bellechasse | 1,956 | 2,071 | −5.6% | 82.07 | 23.8/km2 | |
| Saint-David | Municipality | Pierre-De Saurel | 817 | 832 | −1.8% | 92.90 | 8.8/km2 |
| Saint-David-de-Falardeau | Le Fjord-du-Saguenay | 2,768 | 2,657 | +4.2% | 400.30 | 6.9/km2 | |
| Saint-Denis-De La Bouteillerie | Kamouraska | 517 | 503 | +2.8% | 33.64 | 15.4/km2 | |
| Saint-Denis-de-Brompton | Le Val-Saint-François | 4,054 | 3,402 | +19.2% | 70.39 | 57.6/km2 | |
| Saint-Denis-sur-Richelieu | La Vallée-du-Richelieu | 2,308 | 2,285 | +1.0% | 84.67 | 27.3/km2 | |
| Saint-Didace | Parish | D'Autray | 652 | 593 | +9.9% | 100.50 | 6.5/km2 |
| Saint-Dominique | Municipality | Les Maskoutains | 2,553 | 2,327 | +9.7% | 70.48 | 36.2/km2 |
| Saint-Dominique-du-Rosaire | Abitibi | 450 | 434 | +3.7% | 482.89 | 0.9/km2 | |
| Saint-Donat | Matawinie | 3,888 | 4,130 | −5.9% | 352.33 | 11.0/km2 | |
| Saint-Donat | Parish | La Mitis | 876 | 890 | −1.6% | 95.58 | 9.2/km2 |
| Saint-Edmond-de-Grantham | Drummond | 762 | 673 | +13.2% | 48.30 | 15.8/km2 | |
| Saint-Edmond-les-Plaines | Municipality | Maria-Chapdelaine | 381 | 390 | −2.3% | 84.41 | 4.5/km2 |
| Saint-Édouard | Les Jardins-de-Napierville | 1,321 | 1,312 | +0.7% | 52.69 | 25.1/km2 | |
| Saint-Édouard-de-Fabre | Parish | Témiscamingue | 628 | 649 | −3.2% | 191.91 | 3.3/km2 |
| Saint-Édouard-de-Lotbinière | Lotbinière | 1,194 | 1,248 | −4.3% | 98.43 | 12.1/km2 | |
| Saint-Édouard-de-Maskinongé | Municipality | Maskinongé | 712 | 774 | −8.0% | 52.84 | 13.5/km2 |
| Saint-Élie-de-Caxton | 1,836 | 1,758 | +4.4% | 118.11 | 15.5/km2 | ||
| Saint-Éloi | Parish | Les Basques | 286 | 311 | −8.0% | 66.11 | 4.3/km2 |
| Saint-Elphège | Nicolet-Yamaska | 270 | 292 | −7.5% | 40.55 | 6.7/km2 | |
| Saint-Elzéar | Municipality | Bonaventure | 458 | 467 | −1.9% | 203.58 | 2.2/km2 |
| Saint-Elzéar | La Nouvelle-Beauce | 2,400 | 2,107 | +13.9% | 87.07 | 27.6/km2 | |
| Saint-Elzéar-de-Témiscouata | Témiscouata | 321 | 343 | −6.4% | 151.34 | 2.1/km2 | |
| Saint-Émile-de-Suffolk | Papineau | 477 | 566 | −15.7% | 56.68 | 8.4/km2 | |
| Saint-Éphrem-de-Beauce | Beauce-Sartigan | 2,400 | 2,567 | −6.5% | 118.87 | 20.2/km2 | |
| Saint-Épiphane | Rivière-du-Loup | 827 | 849 | −2.6% | 82.85 | 10.0/km2 | |
| Saint-Esprit | Montcalm | 1,967 | 1,963 | +0.2% | 54.16 | 36.3/km2 | |
| Saint-Étienne-de-Beauharnois | Beauharnois-Salaberry | 831 | 806 | +3.1% | 40.79 | 20.4/km2 | |
| Saint-Étienne-de-Bolton | Memphrémagog | 674 | 534 | +26.2% | 47.41 | 14.2/km2 | |
| Saint-Étienne-des-Grès | Parish | Maskinongé | 4,541 | 4,217 | +7.7% | 104.58 | 43.4/km2 |
| Saint-Eugène | Municipality | Drummond | 1,126 | 1,131 | −0.4% | 75.85 | 14.8/km2 |
| Saint-Eugène-d'Argentenay | Maria-Chapdelaine | 488 | 546 | −10.6% | 88.11 | 5.5/km2 | |
| Saint-Eugène-de-Guigues | Témiscamingue | 465 | 454 | +2.4% | 110.02 | 4.2/km2 | |
| Saint-Eugène-de-Ladrière | Parish | Rimouski-Neigette | 364 | 421 | −13.5% | 333.64 | 1.1/km2 |
| Saint-Eusèbe | Témiscouata | 593 | 614 | −3.4% | 129.64 | 4.6/km2 | |
| Saint-Eustache | Town | Deux-Montagnes | 44,008 | 44,154 | −0.3% | 70.51 | 624.1/km2 |
| Saint-Évariste-de-Forsyth | Municipality | Beauce-Sartigan | 540 | 525 | +2.9% | 110.94 | 4.9/km2 |
| Saint-Fabien | Parish | Rimouski-Neigette | 1,837 | 1,906 | −3.6% | 121.20 | 15.2/km2 |
| Saint-Fabien-de-Panet | Montmagny | 954 | 992 | −3.8% | 187.25 | 5.1/km2 | |
| Saint-Félicien | Town | Le Domaine-du-Roy | 10,238 | 10,278 | −0.4% | 363.19 | 28.2/km2 |
| Saint-Félix-de-Dalquier | Municipality | Abitibi | 940 | 856 | +9.8% | 113.57 | 8.3/km2 |
| Saint-Félix-de-Kingsey | Drummond | 1,430 | 1,563 | −8.5% | 126.29 | 11.3/km2 | |
| Saint-Félix-de-Valois | Matawinie | 6,305 | 6,029 | +4.6% | 88.25 | 71.4/km2 | |
| Saint-Félix-d'Otis | Le Fjord-du-Saguenay | 956 | 1,007 | −5.1% | 233.22 | 4.1/km2 | |
| Saint-Ferdinand | L'Érable | 2,076 | 2,067 | +0.4% | 137.17 | 15.1/km2 | |
| Saint-Ferréol-les-Neiges | La Côte-de-Beaupré | 3,240 | 2,964 | +9.3% | 83.36 | 38.9/km2 | |
| Saint-Flavien | Lotbinière | 1,618 | 1,578 | +2.5% | 66.24 | 24.4/km2 | |
| Saint-Fortunat | Les Appalaches | 263 | 280 | −6.1% | 76.12 | 3.5/km2 | |
| Saint-François-d'Assise | Avignon | 644 | 706 | −8.8% | 178.56 | 3.6/km2 | |
| Saint-François-de-la-Rivière-du-Sud | Montmagny | 1,623 | 1,596 | +1.7% | 96.39 | 16.8/km2 | |
| Saint-François-de-l'Île-d'Orléans | L'Île-d'Orléans | 527 | 527 | 0.0% | 28.84 | 18.3/km2 | |
| Saint-François-de-Sales | Le Domaine-du-Roy | 616 | 654 | −5.8% | 197.45 | 3.1/km2 | |
| Saint-François-du-Lac | Nicolet-Yamaska | 1,965 | 1,957 | +0.4% | 64.19 | 30.6/km2 | |
| Saint-François-Xavier-de-Brompton | Le Val-Saint-François | 2,273 | 2,101 | +8.2% | 97.80 | 23.2/km2 | |
| Saint-François-Xavier-de-Viger | Rivière-du-Loup | 245 | 256 | −4.3% | 111.36 | 2.2/km2 | |
| Saint-Frédéric | Parish | Robert-Cliche | 1,044 | 1,085 | −3.8% | 72.50 | 14.4/km2 |
| Saint-Fulgence | Municipality | Le Fjord-du-Saguenay | 2,071 | 1,949 | +6.3% | 352.78 | 5.9/km2 |
| Saint-Gabriel | Town | D'Autray | 2,640 | 2,844 | −7.2% | 2.83 | 932.9/km2 |
| Saint-Gabriel-de-Brandon | Municipality | 2,635 | 2,679 | −1.6% | 99.44 | 26.5/km2 | |
| Saint-Gabriel-de-Rimouski | La Mitis | 1,167 | 1,180 | −1.1% | 127.04 | 9.2/km2 | |
| Saint-Gabriel-de-Valcartier | La Jacques-Cartier | 3,382 | 2,933 | +15.3% | 435.22 | 7.8/km2 | |
| Saint-Gabriel-Lalemant | Kamouraska | 716 | 799 | −10.4% | 78.05 | 9.2/km2 | |
| Saint-Gédéon | Lac-Saint-Jean-Est | 2,085 | 2,001 | +4.2% | 63.49 | 32.8/km2 | |
| Saint-Gédéon-de-Beauce | Beauce-Sartigan | 2,205 | 2,277 | −3.2% | 197.52 | 11.2/km2 | |
| Saint-Georges | Town | 32,513 | 31,173 | +4.3% | 199.27 | 163.2/km2 | |
| Saint-Georges-de-Clarenceville | Municipality | Le Haut-Richelieu | 1,103 | 1,056 | +4.5% | 63.46 | 17.4/km2 |
| Saint-Georges-de-Windsor | Les Sources | 958 | 911 | +5.2% | 127.66 | 7.5/km2 | |
| Saint-Gérard-Majella | Parish | Pierre-De Saurel | 242 | 246 | −1.6% | 38.32 | 6.3/km2 |
| Saint-Germain-de-Grantham | Municipality | Drummond | 4,917 | 4,551 | +8.0% | 87.46 | 56.2/km2 |
| Saint-Germain-de-Kamouraska | Kamouraska | 286 | 280 | +2.1% | 28.60 | 10.0/km2 | |
| Saint-Gervais | Bellechasse | 2,153 | 2,058 | +4.6% | 89.36 | 24.1/km2 | |
| Saint-Gilbert | Parish | Portneuf | 296 | 282 | +5.0% | 37.46 | 7.9/km2 |
| Saint-Gilles | Municipality | Lotbinière | 2,525 | 2,138 | +18.1% | 177.43 | 14.2/km2 |
| Saint-Godefroi | Township | Bonaventure | 380 | 405 | −6.2% | 63.52 | 6.0/km2 |
| Saint-Guillaume | Municipality | Drummond | 1,476 | 1,547 | −4.6% | 87.88 | 16.8/km2 |
| Saint-Guy | Les Basques | 54 | 91 | −40.7% | 139.82 | 0.4/km2 | |
| Saint-Henri | Bellechasse | 5,611 | 5,023 | +11.7% | 122.57 | 45.8/km2 | |
| Saint-Henri-de-Taillon | Lac-Saint-Jean-Est | 821 | 760 | +8.0% | 61.45 | 13.4/km2 | |
| Saint-Herménégilde | Coaticook | 670 | 702 | −4.6% | 166.42 | 4.0/km2 | |
| Saint-Hilaire-de-Dorset | Parish | Beauce-Sartigan | 95 | 99 | −4.0% | 187.13 | 0.5/km2 |
| Saint-Hilarion | Charlevoix | 1,127 | 1,181 | −4.6% | 100.31 | 11.2/km2 | |
| Saint-Hippolyte | Municipality | La Rivière-du-Nord | 9,113 | 8,083 | +12.7% | 120.72 | 75.5/km2 |
| Saint-Honoré | Town | Le Fjord-du-Saguenay | 5,757 | 5,257 | +9.5% | 189.54 | 30.4/km2 |
| Saint-Honoré-de-Shenley | Municipality | Beauce-Sartigan | 1,483 | 1,610 | −7.9% | 134.00 | 11.1/km2 |
| Saint-Honoré-de-Témiscouata | Témiscouata | 741 | 780 | −5.0% | 263.20 | 2.8/km2 | |
| Saint-Hubert-de-Rivière-du-Loup | Rivière-du-Loup | 1,279 | 1,235 | +3.6% | 192.76 | 6.6/km2 | |
| Saint-Hugues | Les Maskoutains | 1,327 | 1,292 | +2.7% | 84.71 | 15.7/km2 | |
| Saint-Hyacinthe | Town | 55,648 | 53,236 | +4.5% | 188.97 | 294.5/km2 | |
| Saint-Ignace-de-Loyola | Municipality | D'Autray | 2,049 | 2,086 | −1.8% | 36.16 | 56.7/km2 |
| Saint-Ignace-de-Stanbridge | Brome-Missisquoi | 676 | 638 | +6.0% | 69.43 | 9.7/km2 | |
| Saint-Irénée | Charlevoix-Est | 641 | 674 | −4.9% | 60.38 | 10.6/km2 | |
| Saint-Isidore | Municipality | La Nouvelle-Beauce | 2,880 | 2,947 | −2.3% | 102.65 | 28.1/km2 |
| Saint-Isidore | Parish | Roussillon | 2,608 | 2,581 | +1.0% | 52.32 | 49.8/km2 |
| Saint-Isidore-de-Clifton | Municipality | Le Haut-Saint-François | 695 | 716 | −2.9% | 177.30 | 3.9/km2 |
| Saint-Jacques | Montcalm | 3,971 | 4,021 | −1.2% | 67.26 | 59.0/km2 | |
| Saint-Jacques-de-Leeds | Les Appalaches | 685 | 711 | −3.7% | 80.57 | 8.5/km2 | |
| Saint-Jacques-le-Majeur-de-Wolfestown | Parish | 188 | 189 | −0.5% | 58.79 | 3.2/km2 | |
| Saint-Jacques-le-Mineur | Municipality | Les Jardins-de-Napierville | 1,690 | 1,672 | +1.1% | 67.19 | 25.2/km2 |
| Saint-Janvier-de-Joly | Lotbinière | 984 | 968 | +1.7% | 109.73 | 9.0/km2 | |
| Saint-Jean-Baptiste | La Vallée-du-Richelieu | 3,107 | 3,191 | −2.6% | 72.41 | 42.9/km2 | |
| Saint-Jean-de-Brébeuf | Les Appalaches | 372 | 359 | +3.6% | 79.18 | 4.7/km2 | |
| Saint-Jean-de-Cherbourg | Parish | La Matanie | 165[6] | 193 | −14.5% | 114.05 | 1.4/km2 |
| Saint-Jean-de-Dieu | Municipality | Les Basques | 1,596 | 1,606 | −0.6% | 152.38 | 10.5/km2 |
| Saint-Jean-de-la-Lande | Témiscouata | 248 | 310 | −20.0% | 107.05 | 2.3/km2 | |
| Saint-Jean-de-l'Île-d'Orléans | L'Île-d'Orléans | 1,059 | 923 | +14.7% | 43.63 | 24.3/km2 | |
| Saint-Jean-de-Matha | Matawinie | 4,450 | 4,335 | +2.7% | 109.36 | 40.7/km2 | |
| Saint-Jean-Port-Joli | L'Islet | 3,407 | 3,304 | +3.1% | 69.37 | 49.1/km2 | |
| Saint-Jean-sur-Richelieu | Town | Le Haut-Richelieu | 95,114 | 92,394 | +2.9% | 226.63 | 419.7/km2 |
| Saint-Jérôme | La Rivière-du-Nord | 74,346 | 68,456 | +8.6% | 90.44 | 822.0/km2 | |
| Saint-Joachim | Parish | La Côte-de-Beaupré | 1,441 | 1,471 | −2.0% | 42.51 | 33.9/km2 |
| Saint-Joachim-de-Shefford | Municipality | La Haute-Yamaska | 1,301 | 1,171 | +11.1% | 127.09 | 10.2/km2 |
| Saint-Joseph-de-Beauce | Town | Robert-Cliche | 4,858 | 4,722 | +2.9% | 114.87 | 42.3/km2 |
| Saint-Joseph-de-Coleraine | Municipality | Les Appalaches | 1,762 | 1,870 | −5.8% | 126.99 | 13.9/km2 |
| Saint-Joseph-de-Kamouraska | Parish | Kamouraska | 391 | 418 | −6.5% | 85.58 | 4.6/km2 |
| Saint-Joseph-de-Lepage | La Mitis | 523 | 527 | −0.8% | 30.91 | 16.9/km2 | |
| Saint-Joseph-des-Érables | Municipality | Robert-Cliche | 410 | 420 | −2.4% | 51.56 | 8.0/km2 |
| Saint-Joseph-de-Sorel | Town | Pierre-De Saurel | 1,642 | 1,677 | −2.1% | 1.38 | 1,189.9/km2 |
| Saint-Joseph-du-Lac | Municipality | Deux-Montagnes | 6,687 | 6,195 | +7.9% | 41.32 | 161.8/km2 |
| Saint-Jude | Les Maskoutains | 1,214 | 1,235 | −1.7% | 77.36 | 15.7/km2 | |
| Saint-Jules | Parish | Robert-Cliche | 539 | 573 | −5.9% | 55.74 | 9.7/km2 |
| Saint-Julien | Municipality | Les Appalaches | 376 | 406 | −7.4% | 81.72 | 4.6/km2 |
| Saint-Just-de-Bretenières | Montmagny | 668 | 709 | −5.8% | 132.63 | 5.0/km2 | |
| Saint-Juste-du-Lac | Témiscouata | 561 | 585 | −4.1% | 167.10 | 3.4/km2 | |
| Saint-Justin | Maskinongé | 973 | 1,060 | −8.2% | 78.62 | 12.4/km2 | |
| Saint-Lambert | Parish | Abitibi-Ouest | 194 | 211 | −8.1% | 100.23 | 1.9/km2 |
| Saint-Lambert | Town | Longueuil | 21,861 | 21,555 | +1.4% | 7.59 | 2,880.2/km2 |
| Saint-Lambert-de-Lauzon | Municipality | La Nouvelle-Beauce | 6,647 | 6,177 | +7.6% | 106.88 | 62.2/km2 |
| Saint-Laurent-de-l'Île-d'Orléans | L'Île-d'Orléans | 1,532 | 1,580 | −3.0% | 35.86 | 42.7/km2 | |
| Saint-Lazare | Town | Vaudreuil-Soulanges | 19,889 | 19,295 | +3.1% | 66.80 | 297.7/km2 |
| Saint-Lazare-de-Bellechasse | Municipality | Bellechasse | 1,288 | 1,172 | +9.9% | 85.91 | 15.0/km2 |
| Saint-Léandre | Parish | La Matanie | 400 | 402 | −0.5% | 105.01 | 3.8/km2 |
| Saint-Léonard-d'Aston | Municipality | Nicolet-Yamaska | 2,331 | 2,271 | +2.6% | 82.59 | 28.2/km2 |
| Saint-Léonard-de-Portneuf | Portneuf | 1,112[6] | 1,019 | +9.1% | 142.00 | 7.8/km2 | |
| Saint-Léon-de-Standon | Parish | Bellechasse | 1,127 | 1,128 | −0.1% | 136.94 | 8.2/km2 |
| Saint-Léon-le-Grand | La Matapédia | 953 | 970 | −1.8% | 128.47 | 7.4/km2 | |
| Saint-Léon-le-Grand | Maskinongé | 928 | 992 | −6.5% | 76.11 | 12.2/km2 | |
| Saint-Liboire | Municipality | Les Maskoutains | 3,062 | 3,051 | +0.4% | 73.86 | 41.5/km2 |
| Saint-Liguori | Montcalm | 1,943 | 1,976 | −1.7% | 50.70 | 38.3/km2 | |
| Saint-Lin–Laurentides | Town | 20,786 | 17,463 | +19.0% | 118.36 | 175.6/km2 | |
| Saint-Louis | Municipality | Les Maskoutains | 712 | 775 | −8.1% | 47.27 | 15.1/km2 |
| Saint-Louis-de-Blandford | Arthabaska | 1,011 | 903 | +12.0% | 105.85 | 9.6/km2 | |
| Saint-Louis-de-Gonzague | Les Etchemins | 374 | 421 | −11.2% | 118.02 | 3.2/km2 | |
| Saint-Louis-de-Gonzague | Parish | Beauharnois-Salaberry | 1,481 | 1,389 | +6.6% | 79.83 | 18.6/km2 |
| Saint-Louis-de-Gonzague-du-Cap-Tourmente | La Côte-de-Beaupré | 5 | 5 | 0.0% | 0.42 | 11.9/km2 | |
| Saint-Louis-du-Ha! Ha! | Témiscouata | 1,292 | 1,318 | −2.0% | 112.25 | 11.5/km2 | |
| Saint-Luc-de-Bellechasse | Municipality | Les Etchemins | 438 | 480 | −8.8% | 162.01 | 2.7/km2 |
| Saint-Luc-de-Vincennes | Les Chenaux | 545 | 591 | −7.8% | 53.67 | 10.2/km2 | |
| Saint-Lucien | Drummond | 1,647 | 1,584 | +4.0% | 111.29 | 14.8/km2 | |
| Saint-Ludger | Le Granit | 1,071 | 1,255 | −14.7% | 127.64 | 8.4/km2 | |
| Saint-Ludger-de-Milot | Lac-Saint-Jean-Est | 651 | 678 | −4.0% | 108.75 | 6.0/km2 | |
| Saint-Magloire | Les Etchemins | 676 | 725 | −6.8% | 208.68 | 3.2/km2 | |
| Saint-Majorique-de-Grantham | Parish | Drummond | 1,388 | 1,251 | +11.0% | 57.62 | 24.1/km2 |
| Saint-Malachie | Bellechasse | 1,517 | 1,489 | +1.9% | 101.06 | 15.0/km2 | |
| Saint-Malo | Municipality | Coaticook | 475 | 483 | −1.7% | 131.93 | 3.6/km2 |
| Saint-Marc-de-Figuery | Parish | Abitibi | 834 | 771 | +8.2% | 81.83 | 10.2/km2 |
| Saint-Marc-des-Carrières | Town | Portneuf | 2,911 | 2,862 | +1.7% | 17.27 | 168.6/km2 |
| Saint-Marc-du-Lac-Long | Parish | Témiscouata | 397 | 440 | −9.8% | 148.85 | 2.7/km2 |
| Saint-Marcel | Municipality | L'Islet | 428 | 439 | −2.5% | 179.04 | 2.4/km2 |
| Saint-Marcel-de-Richelieu | Les Maskoutains | 497 | 543 | −8.5% | 51.28 | 9.7/km2 | |
| Saint-Marcellin | Parish | Rimouski-Neigette | 353 | 323 | +9.3% | 117.56 | 3.0/km2 |
| Saint-Marc-sur-Richelieu | Municipality | La Vallée-du-Richelieu | 2,172 | 2,050 | +6.0% | 60.99 | 35.6/km2 |
| Saint-Martin | Parish | Beauce-Sartigan | 2,477 | 2,462 | +0.6% | 118.06 | 21.0/km2 |
| Saint-Mathias-sur-Richelieu | Municipality | Rouville | 4,531 | 4,618 | −1.9% | 47.15 | 96.1/km2 |
| Saint-Mathieu | Roussillon | 2,156 | 1,879 | +14.7% | 31.43 | 68.6/km2 | |
| Saint-Mathieu-de-Beloeil | La Vallée-du-Richelieu | 2,619 | 2,624 | −0.2% | 39.41 | 66.5/km2 | |
| Saint-Mathieu-de-Rioux | Les Basques | 639 | 678 | −5.8% | 107.82 | 5.9/km2 | |
| Saint-Mathieu-d'Harricana | Abitibi | 739 | 696 | +6.2% | 106.71 | 6.9/km2 | |
| Saint-Mathieu-du-Parc | Maskinongé | 1,338 | 1,407 | −4.9% | 220.15 | 6.1/km2 | |
| Saint-Maurice | Parish | Les Chenaux | 3,286 | 2,775 | +18.4% | 91.34 | 36.0/km2 |
| Saint-Maxime-du-Mont-Louis | Municipality | La Haute-Gaspésie | 1,134 | 1,118 | +1.4% | 233.63 | 4.9/km2 |
| Saint-Médard | Les Basques | 209 | 222 | −5.9% | 75.28 | 2.8/km2 | |
| Saint-Michel | Les Jardins-de-Napierville | 3,186 | 2,884 | +10.5% | 59.98 | 53.1/km2 | |
| Saint-Michel-de-Bellechasse | Bellechasse | 1,813 | 1,816 | −0.2% | 43.52 | 41.7/km2 | |
| Saint-Michel-des-Saints | Matawinie | 2,359 | 2,436 | −3.2% | 501.61 | 4.7/km2 | |
| Saint-Michel-du-Squatec | Témiscouata | 1,113 | 1,171 | −5.0% | 362.03 | 3.1/km2 | |
| Saint-Modeste | Rivière-du-Loup | 1,162 | 1,128 | +3.0% | 110.02 | 10.6/km2 | |
| Saint-Moïse | Parish | La Matapédia | 580 | 577 | +0.5% | 109.93 | 5.3/km2 |
| Saint-Narcisse | Les Chenaux | 1,832 | 1,762 | +4.0% | 106.85 | 17.1/km2 | |
| Saint-Narcisse-de-Beaurivage | Lotbinière | 1,106 | 1,091 | +1.4% | 61.93 | 17.9/km2 | |
| Saint-Narcisse-de-Rimouski | Rimouski-Neigette | 961 | 1,017 | −5.5% | 163.41 | 5.9/km2 | |
| Saint-Nazaire | Municipality | Lac-Saint-Jean-Est | 2,073 | 2,114 | −1.9% | 145.00 | 14.3/km2 |
| Saint-Nazaire-d'Acton | Parish | Acton | 884 | 826 | +7.0% | 58.05 | 15.2/km2 |
| Saint-Nazaire-de-Dorchester | Bellechasse | 363 | 355 | +2.3% | 51.59 | 7.0/km2 | |
| Saint-Nérée-de-Bellechasse | Municipality | 742 | 743 | −0.1% | 75.78 | 9.8/km2 | |
| Saint-Noël | Village | La Matapédia | 398 | 434 | −8.3% | 45.85 | 8.7/km2 |
| Saint-Norbert | Parish | D'Autray | 1,003 | 1,059 | −5.3% | 74.78 | 13.4/km2 |
| Saint-Norbert-d'Arthabaska | Municipality | Arthabaska | 1,157 | 1,185 | −2.4% | 102.93 | 11.2/km2 |
| Saint-Octave-de-Métis | Parish | La Mitis | 511 | 520 | −1.7% | 75.32 | 6.8/km2 |
| Saint-Odilon-de-Cranbourne | Robert-Cliche | 1,374 | 1,459 | −5.8% | 130.58 | 10.5/km2 | |
| Saint-Omer | Municipality | L'Islet | 277 | 310 | −10.6% | 122.48 | 2.3/km2 |
| Saint-Onésime-d'Ixworth | Kamouraska | 560 | 559 | +0.2% | 102.89 | 5.4/km2 | |
| Saint-Ours | Town | Pierre-De Saurel | 1,669 | 1,721 | −3.0% | 59.31 | 28.1/km2 |
| Saint-Pacôme | Municipality | Kamouraska | 1,598 | 1,658 | −3.6% | 29.15 | 54.8/km2 |
| Saint-Pamphile | Town | L'Islet | 2,400 | 2,685 | −10.6% | 137.77 | 17.4/km2 |
| Saint-Pascal | Kamouraska | 3,468 | 3,490 | −0.6% | 59.69 | 58.1/km2 | |
| Saint-Patrice-de-Beaurivage | Municipality | Lotbinière | 1,036 | 1,080 | −4.1% | 85.55 | 12.1/km2 |
| Saint-Patrice-de-Sherrington | Les Jardins-de-Napierville | 1,960 | 1,971 | −0.6% | 92.62 | 21.2/km2 | |
| Saint-Paul | Joliette | 5,891 | 5,122 | +15.0% | 49.11 | 120.0/km2 | |
| Saint-Paul-d'Abbotsford | Rouville | 2,890 | 2,870 | +0.7% | 79.57 | 36.3/km2 | |
| Saint-Paul-de-la-Croix | Rivière-du-Loup | 309 | 367 | −15.8% | 78.45 | 3.9/km2 | |
| Saint-Paul-de-l'Île-aux-Noix | Le Haut-Richelieu | 1,980 | 1,877 | +5.5% | 29.66 | 66.8/km2 | |
| Saint-Paul-de-Montminy | Montmagny | 785 | 824 | −4.7% | 162.89 | 4.8/km2 | |
| Saint-Paulin | Maskinongé | 1,497 | 1,534 | −2.4% | 95.67 | 15.6/km2 | |
| Saint-Philémon | Parish | Bellechasse | 714 | 742 | −3.8% | 146.54 | 4.9/km2 |
| Saint-Philibert | Municipality | Beauce-Sartigan | 369 | 367 | +0.5% | 57.18 | 6.5/km2 |
| Saint-Philippe | Town | Roussillon | 6,320 | 5,495 | +15.0% | 61.95 | 102.0/km2 |
| Saint-Philippe-de-Néri | Parish | Kamouraska | 832 | 868 | −4.1% | 32.68 | 25.5/km2 |
| Saint-Pie | Town | Les Maskoutains | 5,607 | 5,438 | +3.1% | 107.49 | 52.2/km2 |
| Saint-Pie-de-Guire | Parish | Drummond | 450 | 456 | −1.3% | 51.32 | 8.8/km2 |
| Saint-Pierre | Village | Joliette | 276 | 305 | −9.5% | 9.80 | 28.2/km2 |
| Saint-Pierre-Baptiste | Parish | L'Érable | 527 | 485 | +8.7% | 81.77 | 6.4/km2 |
| Saint-Pierre-de-Broughton | Municipality | Les Appalaches | 898 | 882 | +1.8% | 150.46 | 6.0/km2 |
| Saint-Pierre-de-Lamy | Témiscouata | 117 | 112 | +4.5% | 110.69 | 1.1/km2 | |
| Saint-Pierre-de-la-Rivière-du-Sud | Parish | Montmagny | 907 | 920 | −1.4% | 91.08 | 10.0/km2 |
| Saint-Pierre-de-l'Île-d'Orléans | Municipality | L'Île-d'Orléans | 1,993 | 1,789 | +11.4% | 31.38 | 63.5/km2 |
| Saint-Pierre-les-Becquets | Bécancour | 1,137 | 1,223 | −7.0% | 48.09 | 23.6/km2 | |
| Saint-Placide | Deux-Montagnes | 1,686 | 1,715 | −1.7% | 42.98 | 39.2/km2 | |
| Saint-Polycarpe | Vaudreuil-Soulanges | 2,224 | 1,969 | +13.0% | 70.00 | 31.8/km2 | |
| Saint-Prime | Le Domaine-du-Roy | 2,753 | 2,758 | −0.2% | 147.48 | 18.7/km2 | |
| Saint-Prosper | Les Etchemins | 3,590 | 3,605 | −0.4% | 133.65 | 26.9/km2 | |
| Saint-Prosper-de-Champlain | Les Chenaux | 530 | 505 | +5.0% | 94.02 | 5.6/km2 | |
| Saint-Raphaël | Bellechasse | 2,390 | 2,463 | −3.0% | 121.65 | 19.6/km2 | |
| Saint-Raymond | Town | Portneuf | 10,358[6] | 9,615 | +7.7% | 670.33 | 15.5/km2 |
| Saint-Rémi | Les Jardins-de-Napierville | 8,061 | 7,265 | +11.0% | 78.35 | 102.9/km2 | |
| Saint-Rémi-de-Tingwick | Municipality | Arthabaska | 458 | 474 | −3.4% | 73.03 | 6.3/km2 |
| Saint-René | Parish | Beauce-Sartigan | 745 | 658 | +13.2% | 61.55 | 12.1/km2 |
| Saint-René-de-Matane | Municipality | La Matanie | 991[6] | 1,089 | −9.0% | 255.26 | 3.9/km2 |
| Saint-Robert | Pierre-De Saurel | 1,803 | 1,794 | +0.5% | 64.98 | 27.7/km2 | |
| Saint-Robert-Bellarmin | Le Granit | 575 | 676 | −14.9% | 236.75 | 2.4/km2 | |
| Saint-Roch-de-l'Achigan | Montcalm | 5,147 | 4,892 | +5.2% | 80.29 | 64.1/km2 | |
| Saint-Roch-de-Mékinac | Parish | Mékinac | 302 | 438 | −31.1% | 145.11 | 2.1/km2 |
| Saint-Roch-de-Richelieu | Municipality | Pierre-De Saurel | 2,188 | 2,122 | +3.1% | 34.48 | 63.5/km2 |
| Saint-Roch-des-Aulnaies | L'Islet | 917 | 967 | −5.2% | 49.30 | 18.6/km2 | |
| Saint-Roch-Ouest | Montcalm | 266 | 267 | −0.4% | 20.17 | 13.2/km2 | |
| Saint-Romain | Le Granit | 691 | 707 | −2.3% | 112.30 | 6.2/km2 | |
| Saint-Rosaire | Parish | Arthabaska | 843 | 838 | +0.6% | 109.66 | 7.7/km2 |
| Saint-Samuel | Municipality | 744 | 743 | +0.1% | 43.20 | 17.2/km2 | |
| Saint-Sauveur | Town | Les Pays-d'en-Haut | 10,231 | 9,881 | +3.5% | 47.91 | 213.5/km2 |
| Saint-Sébastien | Municipality | Le Granit | 657 | 697 | −5.7% | 91.98 | 7.1/km2 |
| Saint-Sébastien | Le Haut-Richelieu | 718 | 736 | −2.4% | 63.29 | 11.3/km2 | |
| Saint-Sévère | Parish | Maskinongé | 302 | 318 | −5.0% | 31.87 | 9.5/km2 |
| Saint-Séverin | Mékinac | 846 | 860 | −1.6% | 61.61 | 13.7/km2 | |
| Saint-Séverin | Robert-Cliche | 278 | 266 | +4.5% | 58.93 | 4.7/km2 | |
| Saint-Siméon | Municipality | Charlevoix-Est | 1,227 | 1,300 | −5.6% | 284.14 | 4.3/km2 |
| Saint-Siméon | Parish | Bonaventure | 1,171 | 1,179 | −0.7% | 56.87 | 20.6/km2 |
| Saint-Simon | Municipality | Les Maskoutains | 1,413 | 1,231 | +14.8% | 69.07 | 20.5/km2 |
| Saint-Simon-de-Rimouski | Les Basques | 426 | 438 | −2.7% | 75.01 | 5.7/km2 | |
| Saint-Simon-les-Mines | Beauce-Sartigan | 549 | 496 | +10.7% | 47.45 | 11.6/km2 | |
| Saint-Sixte | Papineau | 469 | 460 | +2.0% | 85.33 | 5.5/km2 | |
| Saint-Stanislas | Les Chenaux | 1,010 | 1,029 | −1.8% | 89.48 | 11.3/km2 | |
| Saint-Stanislas | Maria-Chapdelaine | 373 | 353 | +5.7% | 153.48 | 2.4/km2 | |
| Saint-Stanislas-de-Kostka | Beauharnois-Salaberry | 1,654 | 1,553 | +6.5% | 57.72 | 28.7/km2 | |
| Saint-Sulpice | Parish | L'Assomption | 3,439 | 3,273 | +5.1% | 36.36 | 94.6/km2 |
| Saint-Sylvère | Municipality | Bécancour | 791 | 865 | −8.6% | 86.31 | 9.2/km2 |
| Saint-Sylvestre | Lotbinière | 1,019 | 1,035 | −1.5% | 147.18 | 6.9/km2 | |
| Saint-Télesphore | Vaudreuil-Soulanges | 759 | 762 | −0.4% | 60.33 | 12.6/km2 | |
| Saint-Tharcisius | Parish | La Matapédia | 421[6] | 464 | −9.3% | 79.11 | 5.3/km2 |
| Saint-Théodore-d'Acton | Municipality | Acton | 1,519 | 1,471 | +3.3% | 82.90 | 18.3/km2 |
| Saint-Théophile | Beauce-Sartigan | 713 | 743 | −4.0% | 428.35 | 1.7/km2 | |
| Saint-Thomas | Joliette | 3,249 | 3,193 | +1.8% | 94.80 | 34.3/km2 | |
| Saint-Thomas-Didyme | Maria-Chapdelaine | 676 | 677 | −0.1% | 339.79 | 2.0/km2 | |
| Saint-Thuribe | Parish | Portneuf | 286 | 288 | −0.7% | 50.93 | 5.6/km2 |
| Saint-Tite | Town | Mékinac | 3,673 | 3,880 | −5.3% | 91.33 | 40.2/km2 |
| Saint-Tite-des-Caps | Municipality | La Côte-de-Beaupré | 1,473 | 1,506 | −2.2% | 129.21 | 11.4/km2 |
| Saint-Ubalde | Portneuf | 1,412 | 1,403 | +0.6% | 140.72 | 10.0/km2 | |
| Saint-Ulric | La Matanie | 1,585 | 1,642 | −3.5% | 120.65 | 13.1/km2 | |
| Saint-Urbain | Parish | Charlevoix | 1,373 | 1,474 | −6.9% | 334.83 | 4.1/km2 |
| Saint-Urbain-Premier | Municipality | Beauharnois-Salaberry | 1,264 | 1,148 | +10.1% | 53.29 | 23.7/km2 |
| Saint-Valentin | Le Haut-Richelieu | 447 | 470 | −4.9% | 39.28 | 11.4/km2 | |
| Saint-Valère | Arthabaska | 1,263 | 1,286 | −1.8% | 108.11 | 11.7/km2 | |
| Saint-Valérien | Parish | Rimouski-Neigette | 816 | 893 | −8.6% | 145.27 | 5.6/km2 |
| Saint-Valérien-de-Milton | Municipality | Les Maskoutains | 1,793 | 1,840 | −2.6% | 107.01 | 16.8/km2 |
| Saint-Vallier | Bellechasse | 1,061 | 1,046 | +1.4% | 45.03 | 23.6/km2 | |
| Saint-Venant-de-Paquette | Coaticook | 97 | 104 | −6.7% | 58.80 | 1.6/km2 | |
| Saint-Vianney | La Matapédia | 441 | 477 | −7.5% | 145.99 | 3.0/km2 | |
| Saint-Victor | Robert-Cliche | 2,448 | 2,451 | −0.1% | 120.34 | 20.3/km2 | |
| Saint-Wenceslas | Nicolet-Yamaska | 1,157 | 1,064 | +8.7% | 79.67 | 14.5/km2 | |
| Saint-Zacharie | Les Etchemins | 1,653 | 1,751 | −5.6% | 186.77 | 8.9/km2 | |
| Saint-Zénon | Matawinie | 1,120 | 1,250 | −10.4% | 465.23 | 2.4/km2 | |
| Saint-Zénon-du-Lac-Humqui | Parish | La Matapédia | 359 | 366 | −1.9% | 113.42 | 3.2/km2 |
| Saint-Zéphirin-de-Courval | Nicolet-Yamaska | 700 | 737 | −5.0% | 71.97 | 9.7/km2 | |
| Saint-Zotique | Municipality | Vaudreuil-Soulanges | 7,934 | 6,773 | +17.1% | 25.10 | 316.1/km2 |
| Sainte-Adèle | Town | Les Pays-d'en-Haut | 12,919 | 12,137 | +6.4% | 120.95 | 106.8/km2 |
| Sainte-Agathe-de-Lotbinière | Municipality | Lotbinière | 1,168 | 1,145 | +2.0% | 166.99 | 7.0/km2 |
| Sainte-Agathe-des-Monts | Town | Les Laurentides | 10,223 | 10,115 | +1.1% | 130.09 | 78.6/km2 |
| Sainte-Angèle-de-Mérici | Municipality | La Mitis | 953 | 999 | −4.6% | 107.81 | 8.8/km2 |
| Sainte-Angèle-de-Monnoir | Rouville | 1,823 | 1,812 | +0.6% | 44.84 | 40.7/km2 | |
| Sainte-Angèle-de-Prémont | Maskinongé | 596 | 647 | −7.9% | 37.72 | 15.8/km2 | |
| Sainte-Anne-de-Beaupré | Town | La Côte-de-Beaupré | 2,880 | 2,854 | +0.9% | 62.35 | 46.2/km2 |
| Sainte-Anne-de-Bellevue | Montréal | 4,958 | 5,073 | −2.3% | 10.48 | 473.1/km2 | |
| Sainte-Anne-de-la-Pérade | Municipality | Les Chenaux | 2,019 | 2,072 | −2.6% | 109.52 | 18.4/km2 |
| Sainte-Anne-de-la-Pocatière | Parish | Kamouraska | 1,636 | 1,717 | −4.7% | 54.91 | 29.8/km2 |
| Sainte-Anne-de-la-Rochelle | Municipality | Le Val-Saint-François | 598 | 611 | −2.1% | 61.99 | 9.6/km2 |
| Sainte-Anne-de-Sabrevois | Parish | Le Haut-Richelieu | 2,039 | 2,074 | −1.7% | 44.73 | 45.6/km2 |
| Sainte-Anne-des-Lacs | Les Pays-d'en-Haut | 3,611 | 3,363 | +7.4% | 25.23 | 143.1/km2 | |
| Sainte-Anne-des-Monts | Town | La Haute-Gaspésie | 6,437 | 6,933 | −7.2% | 264.09 | 24.4/km2 |
| Sainte-Anne-de-Sorel | Municipality | Pierre-De Saurel | 2,771 | 2,742 | +1.1% | 38.40 | 72.2/km2 |
| Sainte-Anne-des-Plaines | Town | Thérèse-De Blainville | 14,421 | 14,535 | −0.8% | 93.59 | 154.1/km2 |
| Sainte-Anne-du-Lac | Municipality | Antoine-Labelle | 575 | 619 | −7.1% | 322.59 | 1.8/km2 |
| Sainte-Apolline-de-Patton | Parish | Montmagny | 542 | 621 | −12.7% | 256.81 | 2.1/km2 |
| Sainte-Aurélie | Municipality | Les Etchemins | 847 | 910 | −6.9% | 78.23 | 10.8/km2 |
| Sainte-Barbe | Le Haut-Saint-Laurent | 1,324 | 1,403 | −5.6% | 40.16 | 33.0/km2 | |
| Sainte-Béatrix | Matawinie | 1,955 | 1,849 | +5.7% | 83.05 | 23.5/km2 | |
| Sainte-Brigide-d'Iberville | Le Haut-Richelieu | 1,402 | 1,331 | +5.3% | 70.56 | 19.9/km2 | |
| Sainte-Brigitte-de-Laval | Town | La Jacques-Cartier | 7,348 | 5,696 | +29.0% | 108.79 | 67.5/km2 |
| Sainte-Brigitte-des-Saults | Parish | Drummond | 723 | 737 | −1.9% | 70.79 | 10.2/km2 |
| Sainte-Catherine | Town | Roussillon | 17,047 | 16,762 | +1.7% | 9.42 | 1,809.7/km2 |
| Sainte-Catherine-de-Hatley | Municipality | Memphrémagog | 2,479 | 2,464 | +0.6% | 86.37 | 28.7/km2 |
| Sainte-Catherine-de-la-Jacques-Cartier | Town | La Jacques-Cartier | 7,706 | 6,319 | +21.9% | 121.06 | 63.7/km2 |
| Sainte-Cécile-de-Lévrard | Parish | Bécancour | 372 | 362 | +2.8% | 32.32 | 11.5/km2 |
| Sainte-Cécile-de-Milton | Municipality | La Haute-Yamaska | 2,160 | 2,128 | +1.5% | 73.03 | 29.6/km2 |
| Sainte-Cécile-de-Whitton | Le Granit | 863 | 892 | −3.3% | 146.56 | 5.9/km2 | |
| Sainte-Christine | Parish | Acton | 730 | 673 | +8.5% | 92.16 | 7.9/km2 |
| Sainte-Christine-d'Auvergne | Municipality | Portneuf | 551[6] | 448 | +23.0% | 144.28 | 3.8/km2 |
| Sainte-Claire | Bellechasse | 3,362 | 3,325 | +1.1% | 88.06 | 38.2/km2 | |
| Sainte-Clotilde | Les Jardins-de-Napierville | 1,622 | 1,704 | −4.8% | 78.39 | 20.7/km2 | |
| Sainte-Clotilde-de-Beauce | Les Appalaches | 549 | 650 | −15.5% | 60.42 | 9.1/km2 | |
| Sainte-Clotilde-de-Horton | Arthabaska | 1,569 | 1,616 | −2.9% | 114.75 | 13.7/km2 | |
| Sainte-Croix | Lotbinière | 2,516 | 2,352 | +7.0% | 69.86 | 36.0/km2 | |
| Sainte-Edwidge-de-Clifton | Township | Coaticook | 504 | 484 | +4.1% | 101.80 | 5.0/km2 |
| Sainte-Élisabeth | Municipality | D'Autray | 1,459 | 1,559 | −6.4% | 82.96 | 17.6/km2 |
| Sainte-Élizabeth-de-Warwick | Arthabaska | 372 | 374 | −0.5% | 51.96 | 7.2/km2 | |
| Sainte-Émélie-de-l'Énergie | Matawinie | 1,567 | 1,644 | −4.7% | 150.95 | 10.4/km2 | |
| Sainte-Eulalie | Nicolet-Yamaska | 894 | 871 | +2.6% | 86.35 | 10.4/km2 | |
| Sainte-Euphémie-sur-Rivière-du-Sud | Montmagny | 320 | 329 | −2.7% | 92.38 | 3.5/km2 | |
| Sainte-Famille-de-l'Île-d'Orléans | L'Île-d'Orléans | 938 | 851 | +10.2% | 48.76 | 19.2/km2 | |
| Sainte-Félicité | La Matanie | 1,087[6] | 1,175 | −7.5% | 91.38 | 11.9/km2 | |
| Sainte-Félicité | L'Islet | 389 | 413 | −5.8% | 94.81 | 4.1/km2 | |
| Sainte-Flavie | Parish | La Mitis | 884 | 919 | −3.8% | 38.52 | 22.9/km2 |
| Sainte-Florence | Municipality | La Matapédia | 384 | 414 | −7.2% | 103.57 | 3.7/km2 |
| Sainte-Françoise | Bécancour | 449 | 479 | −6.3% | 87.04 | 5.2/km2 | |
| Sainte-Françoise | Parish | Les Basques | 386 | 399 | −3.3% | 88.88 | 4.3/km2 |
| Sainte-Geneviève-de-Batiscan | Les Chenaux | 1,006 | 1,060 | −5.1% | 97.82 | 10.3/km2 | |
| Sainte-Geneviève-de-Berthier | Municipality | D'Autray | 2,280 | 2,365 | −3.6% | 67.62 | 33.7/km2 |
| Sainte-Germaine-Boulé | Abitibi-Ouest | 986 | 895 | +10.2% | 110.33 | 8.9/km2 | |
| Sainte-Gertrude-Manneville | Abitibi | 787 | 757 | +4.0% | 318.80 | 2.5/km2 | |
| Sainte-Hedwidge | Le Domaine-du-Roy | 846 | 824 | +2.7% | 462.77 | 1.8/km2 | |
| Sainte-Hélène-de-Bagot | Les Maskoutains | 1,688 | 1,637 | +3.1% | 72.53 | 23.3/km2 | |
| Sainte-Hélène-de-Chester | Arthabaska | 374 | 358 | +4.5% | 83.68 | 4.5/km2 | |
| Sainte-Hélène-de-Kamouraska | Kamouraska | 918 | 911 | +0.8% | 60.56 | 15.2/km2 | |
| Sainte-Hélène-de-Mancebourg | Parish | Abitibi-Ouest | 373 | 354 | +5.4% | 68.71 | 5.4/km2 |
| Sainte-Hénédine | La Nouvelle-Beauce | 1,271 | 1,212 | +4.9% | 51.54 | 24.7/km2 | |
| Sainte-Irène | La Matapédia | 327 | 341 | −4.1% | 135.25 | 2.4/km2 | |
| Sainte-Jeanne-d'Arc | La Mitis | 280 | 313 | −10.5% | 110.55 | 2.5/km2 | |
| Sainte-Jeanne-d'Arc | Village | Maria-Chapdelaine | 1,050 | 1,089 | −3.6% | 269.17 | 3.9/km2 |
| Sainte-Julie | Town | Marguerite-D'Youville | 29,881 | 30,044 | −0.5% | 48.53 | 615.7/km2 |
| Sainte-Julienne | Municipality | Montcalm | 9,953 | 9,331 | +6.7% | 99.61 | 99.9/km2 |
| Sainte-Justine | Les Etchemins | 1,820 | 1,845 | −1.4% | 126.30 | 14.4/km2 | |
| Sainte-Justine-de-Newton | Vaudreuil-Soulanges | 922 | 973 | −5.2% | 84.63 | 10.9/km2 | |
| Sainte-Louise | Parish | L'Islet | 671 | 704 | −4.7% | 76.60 | 8.8/km2 |
| Sainte-Luce | Municipality | La Mitis | 2,801 | 2,851 | −1.8% | 73.05 | 38.3/km2 |
| Sainte-Lucie-de-Beauregard | Montmagny | 280 | 304 | −7.9% | 82.24 | 3.4/km2 | |
| Sainte-Lucie-des-Laurentides | Les Laurentides | 1,256 | 1,269 | −1.0% | 109.76 | 11.4/km2 | |
| Sainte-Madeleine | Village | Les Maskoutains | 2,233 | 2,356 | −5.2% | 5.37 | 415.8/km2 |
| Sainte-Madeleine-de-la-Rivière-Madeleine | Municipality | La Haute-Gaspésie | 289 | 334 | −13.5% | 263.34 | 1.1/km2 |
| Sainte-Marcelline-de-Kildare | Matawinie | 1,594 | 1,567 | +1.7% | 34.56 | 46.1/km2 | |
| Sainte-Marguerite | Parish | La Nouvelle-Beauce | 1,078 | 1,073 | +0.5% | 83.05 | 13.0/km2 |
| Sainte-Marguerite-du-Lac-Masson | Town | Les Pays-d'en-Haut | 2,763 | 2,740 | +0.8% | 91.96 | 30.0/km2 |
| Sainte-Marguerite-Marie | Municipality | La Matapédia | 166 | 203 | −18.2% | 86.00 | 1.9/km2 |
| Sainte-Marie | Town | La Nouvelle-Beauce | 13,565 | 12,889 | +5.2% | 107.57 | 126.1/km2 |
| Sainte-Marie-de-Blandford | Municipality | Bécancour | 468 | 466 | +0.4% | 69.36 | 6.7/km2 |
| Sainte-Marie-Madeleine | Parish | Les Maskoutains | 2,892 | 2,935 | −1.5% | 50.13 | 57.7/km2 |
| Sainte-Marie-Salomé | Municipality | Montcalm | 1,209 | 1,164 | +3.9% | 33.81 | 35.8/km2 |
| Sainte-Marthe | Vaudreuil-Soulanges | 1,097 | 1,075 | +2.0% | 79.73 | 13.8/km2 | |
| Sainte-Marthe-sur-le-Lac | Town | Deux-Montagnes | 18,074 | 15,689 | +15.2% | 8.75 | 2,065.6/km2 |
| Sainte-Martine | Municipality | Beauharnois-Salaberry | 5,461 | 4,966 | +10.0% | 63.19 | 86.4/km2 |
| Sainte-Mélanie | Joliette | 2,989 | 2,892 | +3.4% | 76.13 | 39.3/km2 | |
| Sainte-Monique | Lac-Saint-Jean-Est | 846 | 865 | −2.2% | 154.77 | 5.5/km2 | |
| Sainte-Monique | Nicolet-Yamaska | 501 | 548 | −8.6% | 58.07 | 8.6/km2 | |
| Sainte-Paule | La Matanie | 233 | 201 | +15.9% | 83.72 | 2.8/km2 | |
| Sainte-Perpétue | L'Islet | 1,639 | 1,774 | −7.6% | 291.21 | 5.6/km2 | |
| Sainte-Perpétue | Parish | Nicolet-Yamaska | 959 | 983 | −2.4% | 71.59 | 13.4/km2 |
| Sainte-Pétronille | Village | L'Île-d'Orléans | 1,033 | 1,041 | −0.8% | 4.38 | 235.8/km2 |
| Sainte-Praxède | Parish | Les Appalaches | 327 | 363 | −9.9% | 136.68 | 2.4/km2 |
| Sainte-Rita | Municipality | Les Basques | 307 | 313 | −1.9% | 129.44 | 2.4/km2 |
| Sainte-Rose-de-Watford | Les Etchemins | 729 | 787 | −7.4% | 115.21 | 6.3/km2 | |
| Sainte-Rose-du-Nord | Parish | Le Fjord-du-Saguenay | 439 | 413 | +6.3% | 116.62 | 3.8/km2 |
| Sainte-Sabine | Municipality | Brome-Missisquoi | 1,085 | 1,120 | −3.1% | 55.34 | 19.6/km2 |
| Sainte-Sabine | Parish | Les Etchemins | 358 | 386 | −7.3% | 66.95 | 5.3/km2 |
| Sainte-Séraphine | Arthabaska | 355 | 378 | −6.1% | 75.88 | 4.7/km2 | |
| Sainte-Sophie | Municipality | La Rivière-du-Nord | 15,690 | 13,375 | +17.3% | 111.41 | 140.8/km2 |
| Sainte-Sophie-de-Lévrard | Parish | Bécancour | 729 | 733 | −0.5% | 84.06 | 8.7/km2 |
| Sainte-Sophie-d'Halifax | Municipality | L'Érable | 612 | 666 | −8.1% | 92.11 | 6.6/km2 |
| Sainte-Thècle | Mékinac | 2,484 | 2,478 | +0.2% | 213.34 | 11.6/km2 | |
| Sainte-Thérèse | Town | Thérèse-De Blainville | 25,989 | 26,025 | −0.1% | 9.48 | 2,741.5/km2 |
| Sainte-Thérèse-de-Gaspé | Municipality | Le Rocher-Percé | 1,015 | 1,055 | −3.8% | 34.41 | 29.5/km2 |
| Sainte-Thérèse-de-la-Gatineau | La Vallée-de-la-Gatineau | 520 | 526 | −1.1% | 61.22 | 8.5/km2 | |
| Sainte-Ursule | Maskinongé | 1,330 | 1,375 | −3.3% | 68.02 | 19.6/km2 | |
| Sainte-Victoire-de-Sorel | Pierre-De Saurel | 2,461 | 2,501 | −1.6% | 75.40 | 32.6/km2 | |
| Saints-Anges | La Nouvelle-Beauce | 1,157 | 1,149 | +0.7% | 68.70 | 16.8/km2 | |
| Saints-Martyrs-Canadiens | Parish | Arthabaska | 254 | 227 | +11.9% | 111.67 | 2.3/km2 |
| Salaberry-de-Valleyfield | Town | Beauharnois-Salaberry | 40,745 | 40,077 | +1.7% | 107.13 | 380.3/km2 |
| Sayabec | Municipality | La Matapédia | 1,831[6] | 1,864 | −1.8% | 130.73 | 14.0/km2 |
| Schefferville | Town | Caniapiscau | 155 | 213 | −27.2% | 27.33 | 5.7/km2 |
| Scotstown | Le Haut-Saint-François | 472 | 547 | −13.7% | 11.46 | 41.2/km2 | |
| Scott | Municipality | La Nouvelle-Beauce | 2,352 | 2,148 | +9.5% | 31.31 | 75.1/km2 |
| Senneterre | Parish | La Vallée-de-l'Or | 1,192 | 1,218 | −2.1% | 568.88 | 2.1/km2 |
| Senneterre | Town | 2,868 | 2,953 | −2.9% | 14,889.93 | 0.2/km2 | |
| Senneville | Village | Montréal | 921 | 920 | +0.1% | 7.53 | 122.3/km2 |
| Sept-Îles | Town | Sept-Rivières | 25,400 | 25,686 | −1.1% | 1,762.92 | 14.4/km2 |
| Shannon | La Jacques-Cartier | 6,031 | 5,086 | +18.6% | 63.78 | 94.6/km2 | |
| Shawinigan | Shawinigan | 49,349 | 50,060 | −1.4% | 734.84 | 67.2/km2 | |
| Shawville | Municipality | Pontiac | 1,587 | 1,664 | −4.6% | 5.39 | 294.4/km2 |
| Sheenboro | Pontiac | 130[6] | 130 | 0.0% | 570.92 | 0.2/km2 | |
| Shefford | Township | La Haute-Yamaska | 6,947 | 6,711 | +3.5% | 118.28 | 58.7/km2 |
| Sherbrooke | Town | Sherbrooke | 161,323 | 154,601 | +4.3% | 353.76 | 456.0/km2 |
| Shigawake | Municipality | Bonaventure | 292 | 338 | −13.6% | 76.82 | 3.8/km2 |
| Sorel-Tracy | Town | Pierre-De Saurel | 34,755 | 34,600 | +0.4% | 57.46 | 604.9/km2 |
| Stanbridge East | Municipality | Brome-Missisquoi | 866 | 873 | −0.8% | 49.54 | 17.5/km2 |
| Stanbridge Station | 274 | 276 | −0.7% | 18.07 | 15.2/km2 | ||
| Stanstead | Township | Memphrémagog | 1,036 | 1,038 | −0.2% | 113.37 | 9.1/km2 |
| Stanstead | Town | 2,788 | 2,857 | −2.4% | 22.00 | 126.7/km2 | |
| Stanstead-Est | Municipality | Coaticook | 584 | 603 | −3.2% | 114.58 | 5.1/km2 |
| Stoke | Le Val-Saint-François | 2,955 | 2,765 | +6.9% | 255.46 | 11.6/km2 | |
| Stoneham-et-Tewkesbury | United township | La Jacques-Cartier | 8,359 | 7,106 | +17.6% | 670.67 | 12.5/km2 |
| Stornoway | Municipality | Le Granit | 530 | 559 | −5.2% | 180.40 | 2.9/km2 |
| Stratford | Township | 945 | 1,062 | −11.0% | 120.89 | 7.8/km2 | |
| Stukely-Sud | Village | Memphrémagog | 1,058 | 999 | +5.9% | 63.31 | 16.7/km2 |
| Sutton | Town | Brome-Missisquoi | 4,012 | 3,906 | +2.7% | 245.95 | 16.3/km2 |
| Tadoussac | Village | La Haute-Côte-Nord | 799 | 813 | −1.7% | 53.96 | 14.8/km2 |
| Taschereau | Municipality | Abitibi-Ouest | 963 | 981 | −1.8% | 250.72 | 3.8/km2 |
| Témiscaming | Town | Témiscamingue | 2,431 | 2,385 | +1.9% | 718.49 | 3.4/km2 |
| Témiscouata-sur-le-Lac | Témiscouata | 4,910 | 5,096 | −3.6% | 218.80 | 22.4/km2 | |
| Terrasse-Vaudreuil | Municipality | Vaudreuil-Soulanges | 1,986 | 1,971 | +0.8% | 1.06 | 1,873.6/km2 |
| Terrebonne | Town | Les Moulins | 111,575 | 106,322 | +4.9% | 154.12 | 723.9/km2 |
| Thetford Mines | Les Appalaches | 25,403 | 25,709 | −1.2% | 226.32 | 112.2/km2 | |
| Thorne | Municipality | Pontiac | 448 | 292 | +53.4% | 175.55 | 2.6/km2 |
| Thurso | Town | Papineau | 2,818 | 2,455 | +14.8% | 6.28 | 448.7/km2 |
| Tingwick | Municipality | Arthabaska | 1,410 | 1,395 | +1.1% | 169.66 | 8.3/km2 |
| Tourville | L'Islet | 589 | 633 | −7.0% | 164.73 | 3.6/km2 | |
| Trécesson | Township | Abitibi | 1,223 | 1,138 | +7.5% | 197.10 | 6.2/km2 |
| Très-Saint-Rédempteur | Municipality | Vaudreuil-Soulanges | 898 | 863 | +4.1% | 26.05 | 34.5/km2 |
| Très-Saint-Sacrement | Parish | Le Haut-Saint-Laurent | 1,186 | 1,155 | +2.7% | 97.53 | 12.2/km2 |
| Tring-Jonction | Village | Robert-Cliche | 1,401 | 1,473 | −4.9% | 27.50 | 50.9/km2 |
| Trois-Pistoles | Town | Les Basques | 3,246 | 3,456 | −6.1% | 7.64 | 424.9/km2 |
| Trois-Rives | Municipality | Mékinac | 396 | 490 | −19.2% | 602.57 | 0.7/km2 |
| Trois-Rivières | Town | Trois-Rivières | 134,413 | 131,338 | +2.3% | 289.32 | 464.6/km2 |
| Ulverton | Municipality | Le Val-Saint-François | 418 | 416 | +0.5% | 51.31 | 8.1/km2 |
| Upton | Acton | 2,092 | 2,075 | +0.8% | 54.80 | 38.2/km2 | |
| Val-Alain | Lotbinière | 924 | 955 | −3.2% | 102.32 | 9.0/km2 | |
| Val-Brillant | La Matapédia | 927 | 955 | −2.9% | 78.04 | 11.9/km2 | |
| Val-David | Village | Les Laurentides | 4,917 | 4,450 | +10.5% | 42.82 | 114.8/km2 |
| Val-des-Bois | Municipality | Papineau | 865 | 938 | −7.8% | 225.42 | 3.8/km2 |
| Val-des-Lacs | Les Laurentides | 744 | 721 | +3.2% | 127.00 | 5.9/km2 | |
| Val-des-Monts | Les Collines-de-l'Outaouais | 11,582 | 10,420 | +11.2% | 441.84 | 26.2/km2 | |
| Val-des-Sources | Town | Les Sources | 6,786 | 7,096 | −4.4% | 30.41 | 223.2/km2 |
| Val-d'Or | Town | La Vallée-de-l'Or | 32,491 | 31,862 | +2.0% | 3,550.70 | 9.2/km2 |
| Val-Joli | Municipality | Le Val-Saint-François | 1,619 | 1,538 | +5.3% | 91.64 | 17.7/km2 |
| Val-Morin | Les Laurentides | 2,870 | 2,772 | +3.5% | 39.42 | 72.8/km2 | |
| Val-Racine | Le Granit | 178 | 170 | +4.7% | 116.23 | 1.5/km2 | |
| Val-Saint-Gilles | Abitibi-Ouest | 157 | 178 | −11.8% | 109.74 | 1.4/km2 | |
| Valcourt | Township | Le Val-Saint-François | 1,044 | 1,047 | −0.3% | 80.68 | 12.9/km2 |
| Valcourt | Town | 2,165 | 2,349 | −7.8% | 5.42 | 399.4/km2 | |
| Vallée-Jonction | Municipality | La Nouvelle-Beauce | 1,875 | 1,940 | −3.4% | 25.35 | 74.0/km2 |
| Varennes | Town | Marguerite-D'Youville | 21,257 | 20,994 | +1.3% | 94.41 | 225.2/km2 |
| Vaudreuil-Dorion | Vaudreuil-Soulanges | 38,117 | 33,305 | +14.4% | 72.73 | 524.1/km2 | |
| Vaudreuil-sur-le-Lac | Village | 1,341 | 1,359 | −1.3% | 1.39 | 964.7/km2 | |
| Venise-en-Québec | Municipality | Le Haut-Richelieu | 1,634 | 1,547 | +5.6% | 13.23 | 123.5/km2 |
| Verchères | Marguerite-D'Youville | 5,835 | 5,692 | +2.5% | 72.57 | 80.4/km2 | |
| Victoriaville | Town | Arthabaska | 46,130 | 43,462 | +6.1% | 84.23 | 547.7/km2 |
| Ville-Marie | Témiscamingue | 2,584 | 2,595 | −0.4% | 5.84 | 442.5/km2 | |
| Villeroy | Municipality | L'Érable | 457 | 485 | −5.8% | 102.15 | 4.5/km2 |
| Waltham | Pontiac | 378 | 384 | −1.6% | 374.22 | 1.0/km2 | |
| Warden | Village | La Haute-Yamaska | 363 | 358 | +1.4% | 5.46 | 66.5/km2 |
| Warwick | Town | Arthabaska | 4,635 | 4,766 | −2.7% | 109.84 | 42.2/km2 |
| Waterloo | La Haute-Yamaska | 4,410 | 4,330 | +1.8% | 12.24 | 360.3/km2 | |
| Waterville | Coaticook | 2,121 | 2,028 | +4.6% | 44.10 | 48.1/km2 | |
| Weedon | Municipality | Le Haut-Saint-François | 2,670 | 2,683 | −0.5% | 216.42 | 12.3/km2 |
| Wentworth | Township | Argenteuil | 533 | 502 | +6.2% | 87.69 | 6.1/km2 |
| Wentworth-Nord | Municipality | Les Pays-d'en-Haut | 1,381 | 1,440 | −4.1% | 156.48 | 8.8/km2 |
| Westbury | Township | Le Haut-Saint-François | 1,006 | 997 | +0.9% | 55.75 | 18.0/km2 |
| Westmount | Town | Montréal | 20,312 | 19,931 | +1.9% | 4.04 | 5,027.7/km2 |
| Wickham | Municipality | Drummond | 2,541 | 2,470 | +2.9% | 98.79 | 25.7/km2 |
| Windsor | Town | Le Val-Saint-François | 5,419 | 5,330 | +1.7% | 14.56 | 372.2/km2 |
| Wotton | Municipality | Les Sources | 1,430 | 1,453 | −1.6% | 143.78 | 9.9/km2 |
| Yamachiche | Maskinongé | 2,830 | 2,787 | +1.5% | 106.47 | 26.6/km2 | |
| Yamaska | Pierre-De Saurel | 1,687 | 1,644 | +2.6% | 72.80 | 23.2/km2 | |
| Sub-total towns | — | — | 6,827,286 | 6,597,044 | +3.5% | 82,276.67 | 82.98/km2 |
| Sub-total villages | — | — | 44,067 | 43,684 | +0.9% | 2,149.04 | 20.51/km2 |
| Sub-total parishes | — | — | 142,373 | 142,262 | +0.1% | 15,736.01 | 9.05/km2 |
| Sub-total townships | — | — | 45,333 | 43,897 | +3.3% | 5,933.79 | 7.64/km2 |
| Sub-total united townships | — | — | 8,654 | 7,410 | +16.8% | 941.09 | 9.20/km2 |
| Sub-total municipalities | — | — | 1,037,909 | 1,014,632 | +2.3% | 404,344.18 | 2.57/km2 |
| Total municipalities | — | — | 8,105,211 | 7,848,929 | +3.3% | 511,380.79 | 15.85/km2 |
| Province of Quebec | — | — | 8,164,361 | 7,903,001 | +3.3% | 1,356,625.27 | 6.02/km2 |
See also[]
- Administrative divisions of Quebec
- List of census agglomerations in Quebec
- List of communities in Quebec
- List of designated places in Quebec
- List of population centres in Quebec
- Municipal history of Quebec
References[]
- ^ "Population and dwelling counts, for Canada, provinces and territories, 2016 and 2011 censuses – 100% data". Statistics Canada. February 8, 2017. Retrieved February 11, 2017.
- ^ a b c d e f g h i "Répertoire des municipalités". Ministry of Municipal Affairs and Land Occupancy. Retrieved October 6, 2019.
- ^ a b c d e f g h i j k l m n o p q r s t "Population and dwelling counts, for Canada, provinces and territories, and census subdivisions (municipalities), 2016 and 2011 censuses – 100% data (Quebec)". Statistics Canada. February 8, 2017. Retrieved April 16, 2017.
- ^ Municipal Code of Quebec (also in French)
- ^ Cities and Towns Act (also in French)
- ^ a b c d e f g h i j k l m n o p q r s t u v w x y z aa ab "Population and dwelling count amendments, 2016 Census". Statistics Canada. January 16, 2018. Retrieved February 3, 2018.
| |||||||||
- Local government in Quebec
- Lists of populated places in Quebec
- Municipalities in Quebec