San Jose del Monte
This article needs additional citations for verification. (August 2010) |
San Jose del Monte
SJDM | |
|---|---|
Component city | |
| City of San Jose del Monte | |
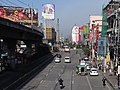
      (From top, left to right : Our Lady of Lourdes Grotto Shrine • St. Joseph the Worker Church • SM City San Jose Del Monte View Deck • Ayala Altaraza • Mount Balagbag • Quirino Highway) | |
 Seal | |
| Nickname(s): The Rising City | |
| Motto(s): Arya San Joseño! | |
| Anthem: San Jose del Monte Hymn | |
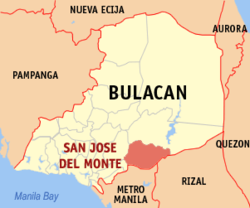 Map of Bulacan with San Jose del Monte highlighted | |
show OpenStreetMap | |
 San Jose del Monte Location within the Philippines | |
| Coordinates: 14°48′50″N 121°02′43″E / 14.8139°N 121.0453°ECoordinates: 14°48′50″N 121°02′43″E / 14.8139°N 121.0453°E | |
| Country | Philippines |
| Region | Central Luzon |
| Province | Bulacan |
| District | Lone district |
| Founded | 2 March 1752 |
| Cityhood | 10 September 2000 |
| Lone district | 18 December 2003 |
| Named for | St. Joseph |
| Barangays | 59 (see Barangays) |
| Government | |
| • Type | Sangguniang Panlungsod |
| • Mayor | Arthur B. Robes |
| • Vice Mayor | Efren C. Bartolome Jr. |
| • Representative | Florida P. Robes |
| • City Council | show
Members |
| • Electorate | 247,567 voters (2019) |
| Area | |
| • Total | 105.53 km2 (40.75 sq mi) |
| Elevation | 122 m (400 ft) |
| Highest elevation | 1,179 m (3,868 ft) |
| Lowest elevation | −1 m (−3 ft) |
| Population (2020 census) [3] | |
| • Total | 651,813 |
| • Density | 6,200/km2 (16,000/sq mi) |
| • Households | 123,530 |
| Demonym(s) | San Joseño |
| Economy | |
| • Income class | 1st city income class |
| • Poverty incidence | 6.97% (2015)[4] |
| • Revenue | |
| • Assets | |
| • Expenditure | |
| Utilities | |
| • Electricity | Meralco |
| Time zone | UTC+8 (PST) |
| ZIP code | 3023, 3024 |
| PSGC | |
| IDD : area code | +63 (0)44 |
| Climate type | tropical monsoon climate |
| Native languages | Tagalog |
| Catholic diocese | Malolos |
| Website | www |


San Jose del Monte, officially the City of San Jose del Monte (abbreviated as SJDM or CSJDM; Tagalog: Lungsod ng San Jose del Monte), is a 1st class component city in the province of Bulacan, Philippines. According to the 2015 census, it has a population of 574,089 people, making it the largest local government unit within the province of Bulacan and Central Luzon and the 18th most populated city in the Philippines. The City of San Jose del Monte, has proclaimed as a highly-urbanized city on December 4, 2020, by the virtue of Proclamation No. 1057, signed by President Rodrigo Duterte and shall take effect after the ratification in a plebiscite.
Located in the southeast of the province, it is bordered by the cities of Caloocan and Quezon in Metro Manila to the south, by the town of Rodriguez, Rizal to the east, the towns of Santa Maria and Marilao to the west and Norzagaray to the north.
The city is home to some of the biggest resettlement areas in the Philippines like the Sapang Palay resettlement area spread over 36 barangays, Pabahay 2000 in Barangay Muzon and Towerville in Barangay Minuyan Proper. Most of the city's population come from former informal settlers along the creeks, esteros, riverbanks and railway tracks of Metro Manila.[6]
History[]
Early accounts on the founding of the city, as gathered from the old people, contend that it was formerly a part of the town of Meycauayan. This is supported by a decree from the Archbishop of Manila dated March 1750 on the creation of new municipalities. The municipality of San Jose del Monte was then officially founded on 2 March 1752.[7]
The decree included the list of families who volunteered to be relocated. These families, most if not all from Lagulo (now Malhacan) in Meycauayan, brought with them rice, wine, nganga and salt from in exchange for the wild pigs, deer, yantok and almasigan of the Itas and Dumagats, the native inhabitants of the area. Solares, including intended lots for main roads, were peacefully distributed to the new occupants after being measured and surveyed.[7]
The town reportedly got its name from Saint Joseph whose statue was found in a veritable forest; the hunters called it “San Jose del Monte” (lit. “Saint Joseph of the Mountain”). In all probability, the hunters reported their find to the parish priest of Meycauayan. It was said that the priest built a stone church at the site where the town proper is now located. The statue was installed in the new church. Extant Catholic Church records reveal that the first parish priest was Father Antonio de Moral. He took charge of the parish in 1845.
During the revolt against Spain, the town became a battleground between the Katipuneros and the Spanish forces. The revolutionaries lost and the vengeful Spanish soldiers burned down the settlement. The town people fled for their lives to nearby towns. At the advent of the American rule, it was made a part of Santa Maria until 1918 when the town was recreated and Ciriaco Gallardo appointed the first municipal president. Public schools were opened at the start of the American regime but due to the scarcity of the population, the highest grade organized was at the fourth grade.
During the Japanese occupation, the town became an ideal hiding place of the local recognized guerrillas because of the town's hilly and wooden terrain. The Japanese Imperial Army took over the local government of San Jose del Monte from 1942 to 1943. In resistance, the municipality formed its own guerrilla unit. San Jose del Monte experienced large casualties when the Americans bombed the town center on 11 January 1945 and again on 14 January 1945. When the combined Filipino and American troops came, peace reigned but not for long.
At the height of the Hukbalahap Rebellion, the town was raided on October 10, 1950. The Huks burned down the town hall. The town was raided for the second time on 21 March 1951. The Huks did not succeed because of the precautionary measures instituted by the town officials after which the Huks were gradually eliminated.
On 10 September 2000, San Jose del Monte was proclaimed as a Component City under Republic Act No. 8797. It became the first city in the province of Bulacán and recorded as the 86th chartered city of the Philippines. On 18 December 2003, the City of San Jose del Monte became the 1st Lone Congressional District in Bulacán.[7]
On December 4, 2020, President Rodrigo Roa Duterte declared San Jose del Monte as a highly-urbanized city through Proclamation No. 1057[8][9]
Geography[]
The elevation of the city ranges from approximately 40–900 meters above sea level; the relief transitions from warm lowland to cool upland as one goes eastward. This is because the city is part of the Sierra Madre mountain range. Plains and river valley flats characterize the western and southwestern quadrant. The central portion and much of its eastern section are made up of undulating hills with low relief. High relief areas moderate slopes best describe its extreme eastern and northwestern quadrant. Slopes of 3%-8% are extensively found in the city, particularly on the western half. Slopes of 30%-50% comprise the smallest portion of the total land area.
The rivers and creeks that flow in San Jose del Monte are direct tributaries of the Angat River, which flows from the Angat Reservoir. Major natural waterways of San Jose del Monte are the Kipungok, Santo Cristo, and Santa Maria river systems. Kipungok River separates San Jose del Monte from Caloocan and Quezon City. It is directly connected to the Marilao River, which flows downwards to Manila Bay. Draining to these rivers are creeks and streams, which act as catchment areas for the surface water runoff of the city. Among these are the Bigte, Kantulot, Katinga, and Salamin creeks.[10]
General land use[]
Growing commercial, residential, and light industrial areas, are found all over the city at major road intersections and along major thoroughfares. However, the bulk of the San Jose del Monte's built-up areas are mostly west of Quirino Highway at the primary level to gently sloping 8% terrain, dividing the city into a heavily built-up western section and the largely agricultural eastern section. Most of the city's schools, government institutions, commercial developments, industries, and other urban amenities are in this section. The largest contiguous built-up area is at Sapang Palay Resettlement Project area, followed by the conurbation in Tungkong Mangga and Muzon.
The developments east of the Quirino Highway are mostly scattered residential areas and agricultural lands. However, there are a few subdivisions that are some distance away from Ciudad Real and take advantage of its secluded and rural atmosphere. These are the Blessed Sacrament Seminary and an Augustinian convent.
In between the built-up clusters are pockets of agricultural lands, which are continuously converted into built-up uses. Planted in these lands are crops such as rice and corn. The clustering pattern for both built-up and agricultural uses is partly due to the decisions made by settlers with regard to the hilly conditions that dominate the topography. Most of households in the western half of San Jose del Monte opted to convert their lands to residential uses while other maintained the farms. This left upland uses, such as those pertaining to forest use, more common towards the easternmost zones.
Most vegetative outgrowths are in areas that are difficult to build on. But there are instances when these outgrowths are integrated in the built-up areas, usually found in the west: a number of heavily vegetated areas. Supplementing these are mini forest projects of the city government. The City Agriculture Office maintains a 1.65-hectare Mini Forest Project in Barangay Muzon along the San Jose del Monte-Marilao Provincial Road and a mahogany planting site.[11]
Climate[]
| hideClimate data for San Jose del Monte City, Bulacan | |||||||||||||
|---|---|---|---|---|---|---|---|---|---|---|---|---|---|
| Month | Jan | Feb | Mar | Apr | May | Jun | Jul | Aug | Sep | Oct | Nov | Dec | Year |
| Average high °C (°F) | 29 (84) |
30 (86) |
32 (90) |
34 (93) |
33 (91) |
31 (88) |
30 (86) |
29 (84) |
29 (84) |
30 (86) |
30 (86) |
29 (84) |
31 (87) |
| Average low °C (°F) | 20 (68) |
20 (68) |
21 (70) |
23 (73) |
24 (75) |
25 (77) |
24 (75) |
24 (75) |
24 (75) |
23 (73) |
22 (72) |
21 (70) |
23 (73) |
| Average precipitation mm (inches) | 7 (0.3) |
7 (0.3) |
9 (0.4) |
21 (0.8) |
101 (4.0) |
152 (6.0) |
188 (7.4) |
170 (6.7) |
159 (6.3) |
115 (4.5) |
47 (1.9) |
29 (1.1) |
1,005 (39.7) |
| Average rainy days | 3.3 | 3.5 | 11.1 | 8.1 | 18.9 | 23.5 | 26.4 | 25.5 | 24.5 | 19.6 | 10.4 | 6.4 | 181.2 |
| Source: Meteoblue [12] | |||||||||||||
Barangays[]
The city is divided into 59 barangays, which handle governance in a much smaller area. These barangays are grouped into two districts, 23 barangays comprise the first district while 36 compose the second commonly known as Sapang Palay, and the city has [clarification needed], which is represented by a congressman in the country's House of Representatives.

| No. | Barangay | District | Postal code | Population 01-May-00 |
Population 2012 |
Population growth rate |
Population 2020 |
|---|---|---|---|---|---|---|---|
| 1 | Ciudad Real | 1st | 3023 | 1,935 | 3,070 | -7.08% | 1,826 |
| 2 | Dulong Bayan | 1st | 3023 | 5,440 | 8,774 | 34.71% | 11,008 |
| 3 | Francisco Homes-Guijo | 1st | 3023 | 5,242 | 5,635 | 2.71% | 6,972 |
| 4 | Francisco Homes-Mulawin | 1st | 3023 | 9,263 | 11,888 | 15.27% | 11,226 |
| 5 | Francisco Homes-Narra | 1st | 3023 | 5,425 | 7,269 | 36.02% | 8,293 |
| 6 | Francisco Homes-Yakal | 1st | 3023 | 2,875 | 3,903 | 15.79% | 3,721 |
| 7 | Gaya-Gaya | 1st | 3023 | 7,148 | 18,737 | 38.51% | 56,896 |
| 8 | Graceville | 1st | 3023 | 22,671 | 44,514 | 44.10% | 42,207 |
| 9 | Gumaoc-Central | 1st | 3023 | 2,704 | 3,484 | 26.11% | 4,123 |
| 10 | Gumaoc-East | 1st | 3023 | 3,854 | 5,237 | 36.53% | 5,376 |
| 11 | Gumaoc-West | 1st | 3023 | 5,288 | 8,785 | 35.89% | 8,885 |
| 12 | Kaybanban | 1st | 3023 | 1,643 | 2,970 | 47.05% | 3,245 |
| 13 | Kaypian | 1st | 3023 | 18,530 | 30,105 | 41.98% | 46,045 |
| 14 | Maharlika | 1st | 3023 | 2,793 | 3,210 | 11.71% | 3,057 |
| 15 | Muzón | 1st | 3023 | 47,010 | 103,000 | 76.24% | 127,506 |
| 16 | Paradise III | 1st | 3023 | 2,186 | 3,907 | 47.35% | 5,318 |
| 17 | Población | 1st | 3023 | 1,886 | 2,360 | 15.22% | 2,273 |
| 18 | Población I | 1st | 3023 | 2,882 | 4,117 | 38.03% | 5,617 |
| 19 | San Isidro | 1st | 3023 | 1,811 | 3,367 | 27.06% | 4,282 |
| 20 | San Manuel | 1st | 3023 | 8,107 | 14,122 | 27.82% | 11,432 |
| 21 | San Roque | 1st | 3023 | 1,000 | 1,711 | 31.90% | 2,492 |
| 22 | Santo Cristo | 1st | 3023 | 17,840 | 33,400 | 43.88% | 49,579 |
| 23 | Tungkong Mangga | 1st | 3023 | 6,097 | 19,491 | 34.64% | 16,324 |
| 24 | Minuyan I | 2nd | 3024 | 3,079 | 3,807 | 10.72% | 3,333 |
| 25 | Minuyan II | 2nd | 3024 | 4,532 | 6,146 | 4.72% | 5,977 |
| 26 | Minuyan III | 2nd | 3024 | 2,327 | 3,328 | 18.22% | 2,673 |
| 27 | Minuyan IV | 2nd | 3024 | 3,492 | 4,722 | 24.03% | 4,769 |
| 28 | Minuyan V | 2nd | 3024 | 2,535 | 2,724 | 9.75% | 2,200 |
| 29 | Bagong Buhay I | 2nd | 3024 | 5,621 | 6,888 | 20.44% | 7,264 |
| 30 | Bagong Buhay II | 2nd | 3024 | 3,521 | 5,910 | 19.31% | 4,175 |
| 31 | Bagong Buhay III | 2nd | 3024 | 3,903 | 4,757 | 19.83% | 5,698 |
| 32 | San Martín I | 2nd | 3024 | 3,207 | 4,049 | 25.54% | 4,095 |
| 33 | San Martín II | 2nd | 3024 | 2,771 | 3,419 | 19.31% | 3,527 |
| 34 | San Martín III | 2nd | 3024 | 2,609 | 3,382 | 13.91% | 3,695 |
| 35 | San Martín IV | 2nd | 3024 | 2,939 | 3,894 | 28.10% | 4,085 |
| 36 | Santa Cruz I | 2nd | 3024 | 2,997 | 2,414 | 7.5% | 4,854 |
| 37 | Santa Cruz II | 2nd | 3024 | 2,798 | 3,744 | 10.51% | 3,405 |
| 38 | Santa Cruz III | 2nd | 3024 | 2,058 | 2,432 | 19.68% | 3,029 |
| 39 | Santa Cruz IV | 2nd | 3024 | 2,623 | 2,706 | 23.83% | 3,175 |
| 40 | Santa Cruz V | 2nd | 3024 | 3,128 | 4,143 | 16.78% | 3,811 |
| 41 | Fátima I | 2nd | 3024 | 2,850 | 3,034 | 9.75% | 3,109 |
| 42 | Fátima II | 2nd | 3024 | 1,785 | 2,116 | 11.82% | 1,890 |
| 43 | Fátima III | 2nd | 3024 | 1,461 | 1,861 | 23.20% | 1,950 |
| 44 | Fátima IV | 2nd | 3024 | 1,837 | 2,294 | 16.93% | 2,121 |
| 45 | Fátima V | 2nd | 3024 | 2,029 | 2,937 | 33.91% | 2,195 |
| 46 | San Pedro | 2nd | 3024 | 12,096 | 14,833 | 13% | 16,439 |
| 47 | Citrus | 2nd | 3024 | 13,066 | 23,970 | 45.75% | 22,893 |
| 48 | San Rafael I | 2nd | 3024 | 6,080 | 9,413 | 28.39% | 8,139 |
| 49 | San Rafael II | 2nd | 3024 | 3,457 | 3,699 | -1.91% | 3,362 |
| 50 | San Rafael III | 2nd | 3024 | 3,112 | 3,248 | -5.49% | 2,718 |
| 51 | San Rafael IV | 2nd | 3024 | 5,308 | 6,695 | 2.60% | 6,447 |
| 52 | San Rafael V | 2nd | 3024 | 2,544 | 3,091 | 9.87% | 2,844 |
| 53 | Assumption | 2nd | 3024 | 3,424 | 4,560 | 14.75% | 4,362 |
| 54 | Lawang Pari | 2nd | 3024 | 3,264 | 4,284 | 28.16% | 5,075 |
| 55 | Santo Niño I | 2nd | 3024 | 2,363 | 3,068 | -1.02% | 2,610 |
| 56 | Santo Niño II | 2nd | 3024 | 2807 | 3,478 | 3.06% | 3,746 |
| 57 | St. Martin de Porres | 2nd | 3024 | 2,050 | 2,775 | 25.46% | 2,470 |
| 58 | Sapang Palay Proper | 2nd | 3024 | 3,576 | 5,538 | 24.89% | 5,804 |
| 59 | Minuyan Proper | 2nd | 3024 | 4,928 | 26,300 | 344.64% | 46,171 |
Of the 3,102 barangays in Region III, the largest in terms of population size is Muzon in the City of San Jose del Monte, Bulacan with 106,603 people. [3]
Demographics[]
| Year | Pop. | ±% p.a. |
|---|---|---|
| 1903 | 1,378 | — |
| 1918 | 3,141 | +5.65% |
| 1939 | 5,826 | +2.99% |
| 1948 | 5,363 | −0.92% |
| 1960 | 9,329 | +4.72% |
| 1970 | 18,704 | +7.19% |
| 1975 | 59,021 | +25.92% |
| 1980 | 90,732 | +8.98% |
| 1990 | 142,047 | +4.59% |
| 1995 | 201,394 | +6.76% |
| 2000 | 315,807 | +10.12% |
| 2007 | 439,090 | +4.65% |
| 2010 | 454,553 | +1.27% |
| 2015 | 574,089 | +4.55% |
| 2020 | 651,813 | +2.53% |
| Source: Philippine Statistics Authority [13] [14] [15][16] | ||
In the 2020 census, the population of San Jose del Monte was 651,813 people, [3] with a density of 6,200 inhabitants per square kilometre or 16,000 inhabitants per square mile. This makes it the largest local government unit in Bulacan province. It is also the largest city in Central Luzon (Region III).[17]
With the coming of settlers to San Jose Del Monte, its population increased tremendously. Its population increased dramatically since the 1950s as the population tended to move from rural areas to towns and cities. Its proximity to Manila allowed it to accommodate its spillover population. This is further hastened by the development of nearby Quezon City and the accompanying increase in population and infrastructure.
Forced relocation of informal settlers and the lure of government to provide them their own homes allowed the town to continue to grow despite the lack of government facilities then. As such, San Jose del Monte exhibited an increasing percentage share to the provincial population from as low as 2% in 1960 to 9% in 1990 and then to 17% in 2015. The town surpassed the population of Meycauayan in 1980 census and Malolos in the 1990 census, then the largest towns of Bulacan. By 2015, it has more than two times the population of the now second place Santa Maria town (256,454 people in the 2015 Census).
If current population growth holds (2010-2015, +4.55%), the population of San Jose del Monte is expected to double and breach one million by the 2030 Census.
Economy[]

Agriculture[]
Major agricultural crops are leafy vegetables, root crops (cassava as its OTOP), pineapple, mango and coffee beans.
Livestock and poultry[]
The major income earner is large- and small-scale swine production. There are 60 commercial livestock and poultry farms in the city. The major poultry producers are RFM Corporation, Vitarich and FELDAN.
Trade and commerce[]
The city has three major business district growth areas: Tungkong Mangga, Muzon and Sapang Palay (Sampol). They are in wholesale and retail trade.
The minor business districts include Towerville in Minuyan Proper, Palmera in Kaypian, Northgate in Santo Cristo, Citrus, Poblacion I, Grotto in Graceville, Francisco Homes, Gumaoc and San Rafael III.
Commercial and thrift banks, pawnshops and cooperatives provide financial services. There are two major malls: Starmall San Jose del Monte in Palmera and SM City San Jose del Monte in Tungkong Mangga.
Tourism[]

Mount Balagbag and Kaytitinga Falls in Barangay, San Isidro are the main tourist attractions in the city. A portion of the Angat Watershed Forest Reserve also extends to San Jose del Monte.
VS Orchids Farm (Santo Cristo) is the biggest orchids nursery and ornamental plants farm in Bulacan (owned by Ms. Rolita Spowart, 3 Manila Seedling Bank Foundation, Quezon City)[24] Hundreds of orchids species are nurtured in this 1.8 hectares flora haven.
The Our Lady of Lourdes Grotto Shrine, is a Roman Catholic pilgrimage site often visited by devotees during the Holy Week.
Infrastructure[]
Transportation[]
The city is serviced by bus routes going to and from, among others, Sapang lamig, Parañaque (Baclaran), Muntinlupa (Alabang), Taguig (FTI), Makati, Quiapo and Santa Cruz districts in Manila, Novaliches district in Quezon City and the Ninoy Aquino International Airport. Jeepney routes also ply the roads between the city and neighboring cities and towns in Metro Manila and Bulacan province.

San Jose del Monte's road network has a total length of 211.43 km (131.38 mi). The following are the main arteries of San Jose del Monte's road network which link the 59 barangays with Metro Manila and the rest of Bulacan.
- Quirino Highway is a national road which stretches from the town of Norzagaray to Caloocan and the rest of Quezon City.
- Bocaue - San Jose Road, also called Gov. Fortunato Halili Avenue, is a provincial road which links the city passing through Tungkong Mangga (Tungko) via Muzon to the town of Santa Maria, Bocaue and to the North Luzon Expressway.
- Sapang Palay Road - Santa Maria Road links the Sapang Palay Resettlement Project to town of Santa Maria passing through Barangay Bulac, Barangay Catmon & Barangay Patag in the said town.
- San Jose - Marilao Road links the city with the municipality of Marilao and to the North Luzon Expressway. This is now a permanent full exit.
- Sapang Palay Road, also called Eduardo V. Roquero Avenue, links the Sapang Palay Resettlement Project to Quirino Highway and in the opposite end to Sapang Palay Proper.
- Igay Road links the upper barangay to Quirino Highway and Rodriguez, Rizal.
Water[]
The bulk of the city's water requirement is being served by the San Jose Del Monte City Water District together via Joint Venture Agreement to Prime Water Corporation.
Power[]
Power distribution is being undertaken by the Manila Electric Company (Meralco). The city hosts the biggest National Grid Corporation of the Philippines (NGCP) sub-station in the country in Barangay Dulong Bayan.
Telecommunications/communications[]
Landline telephone systems are provided by the PLDT and Globe.
Internet service is available through PLDT Home Fiber and DSL and Globe Fiber and Converge Fiber X.
Mobile telephone services are provided by Smart Communications, Globe Telecom and Sun Cellular.
Public High Schools[]
- City of San Jose del Monte National High School
- Muzon National High School
- Graceville National High School
- Muzon Harmony Hills High School
- Minuyan National High School
- Marangal National High School
- Kaypian National High School
- Paradise Farms National High School
- Kakawate National High School
- Citrus National High School
- San Jose del Monte National High School
- San Martin National High School
- Sapang Palay National High School
- Santo Cristo National High School
- San Jose del Monte National Trade School
- Towerville National High School
- City of San Jose del Monte National Science High School
- San Jose Del Monte Heights High School
City government[]

Like other cities in the Philippines, San Jose del Monte is governed by a mayor and vice mayor elected to three-year terms. The mayor is the executive head and leads the city's departments in executing the city ordinances and improving public services. The vice mayor heads a legislative council consisting of 12 members 6 from District I and 6 from District II. The council is in charge of creating the city's policies.
San Jose del Monte, being a part of the Bulacan province, has its mayor in the city council heading the Area Integrated Development Authority (AIDA), a special committee created during the term of then Mayor Eduardo V. Roquero to concentrate on the improvement of 3 highly commercialized areas such as, Tungkong Mangga, Muzon, and Sampol areas.[clarification needed]. This council formulates development plans that seeks to solve the problems and improve the conditions in the metropolis.
Current city officials (2019-2022)[]
| Position | Name | Party | |
|---|---|---|---|
| Mayor | Arthur B. Robes | Arangkada San Joseño | |
| Vice Mayor | Efren Bartolome | Arangkada San Joseño | |
| Representative | Florida P. Robes | PDP–Laban | |
| 1st District | |||
| Councilors | Joey Abela | Arangkada San Joseño | |
| Janet Reyes | Makabayan | ||
| Rosalyn Cabuco | Arangkada San Joseño | ||
| Glenn M. Villano | Arangkada San Joseño | ||
| Liezl Aguirre Abat | National Unity Party | ||
| Richie Robes | Partido Federal ng Pilipinas | ||
| 2nd District | |||
| Councilors | Romeo Agapito | Arangkada San Joseño | |
| Benjie Acibal | Arangkada San Joseño | ||
| Ryan Elfa | Arangkada San Joseño | ||
| Celso Francisco | Arangkada San Joseño | ||
| Argel Joseh Drio | PDP–Laban | ||
| Vanessa Michelle Roquero | National Unity Party | ||
| Ex-Officio Members | |||
| ABC President | Zosimo Lorenzo (Barangay Kaypian) | ||
| SK President | Ronalyn Pordan (Barangay Fatima V) | ||
List of former municipal and city mayors[]
References[]
- ^ City of San Jose del Monte | (DILG)
- ^ "2015 Census of Population, Report No. 3 – Population, Land Area, and Population Density" (PDF). Philippine Statistics Authority. Quezon City, Philippines. August 2016. ISSN 0117-1453. Archived (PDF) from the original on May 25, 2021. Retrieved July 16, 2021.
- ^ Jump up to: a b c Census of Population (2020). "Region III (Central Luzon)". Total Population by Province, City, Municipality and Barangay. PSA. Retrieved 8 July 2021.
- ^ https://psa.gov.ph/sites/default/files/City%20and%20Municipal-level%20Small%20Area%20Poverty%20Estimates_%202009%2C%202012%20and%202015_0.xlsx; publication date: 10 July 2019; publisher: Philippine Statistics Authority.
- ^ "Commission on Audit Annual Audit Reports 2020" (PDF). Quezon City, Philippines: Commission on Audit (COA). Retrieved 7 July 2021.
- ^ Dino Balabo (August 8, 2013). "San Jose del Monte declares moratorium on relocation projects". The Philippine Star. Retrieved October 13, 2015.
- ^ Jump up to: a b c "History of San Jose Del Monte". City of San Jose Del Monte, Bulacan, Philippines. Retrieved 30 June 2017.
 This article incorporates text from this source, which is in the public domain.
- ^ inquirer.net (6 December 2020). "Duterte proclaims San Jose del Monte as a highly-urbanized city – Bulacan solon". Retrieved 6 December 2020.
- ^ lawphil.net (4 December 2020). "PROCLAMATION NO. 1057 CONVERSION OF THE CITY OF SAN JOSE DEL MONTE, BULACAN INTO A HIGHLY-URBANIZED CITY" (PDF). Retrieved 5 December 2020.
- ^ "San Jose del Monte City Government (Geography)". San Jose del Monte City. Archived from the original on 2016-10-22.
- ^ "San Jose del Monte City Government (Land Use)". San Jose del Monte City. Archived from the original on 2016-10-22.
- ^ "San Jose del Monte: Average Temperatures and Rainfall". Meteoblue. Retrieved 12 May 2020.
- ^ Census of Population (2015). "Region III (Central Luzon)". Total Population by Province, City, Municipality and Barangay. PSA. Retrieved 20 June 2016.
- ^ Census of Population and Housing (2010). "Region III (Central Luzon)". Total Population by Province, City, Municipality and Barangay. NSO. Retrieved 29 June 2016.
- ^ Censuses of Population (1903–2007). "Region III (Central Luzon)". Table 1. Population Enumerated in Various Censuses by Province/Highly Urbanized City: 1903 to 2007. NSO.
- ^ "Province of Bulacan". Municipality Population Data. Local Water Utilities Administration Research Division. Retrieved 17 December 2016.
- ^ "Population of Region III - Central Luzon (Based on the 2015 Census of Population)". Philippine Statistics Authority. June 1, 2016. Retrieved 31 August 2017.
- ^ "Poverty incidence (PI):". Philippine Statistics Authority. Retrieved 28 December 2020.
- ^ https://psa.gov.ph/sites/default/files/NSCB_LocalPovertyPhilippines_0.pdf; publication date: 29 November 2005; publisher: Philippine Statistics Authority.
- ^ https://psa.gov.ph/sites/default/files/2003%20SAE%20of%20poverty%20%28Full%20Report%29_1.pdf; publication date: 23 March 2009; publisher: Philippine Statistics Authority.
- ^ https://psa.gov.ph/sites/default/files/2006%20and%202009%20City%20and%20Municipal%20Level%20Poverty%20Estimates_0_1.pdf; publication date: 3 August 2012; publisher: Philippine Statistics Authority.
- ^ https://psa.gov.ph/sites/default/files/2012%20Municipal%20and%20City%20Level%20Poverty%20Estima7tes%20Publication%20%281%29.pdf; publication date: 31 May 2016; publisher: Philippine Statistics Authority.
- ^ https://psa.gov.ph/sites/default/files/City%20and%20Municipal-level%20Small%20Area%20Poverty%20Estimates_%202009%2C%202012%20and%202015_0.xlsx; publication date: 10 July 2019; publisher: Philippine Statistics Authority.
- ^ "Tourism attractions". gov.ph. Retrieved 2019-06-23.
- ^ "DEPED CSJDM". DEPED CSJDM. Retrieved 2019-08-16.
External links[]
 San Jose del Monte travel guide from Wikivoyage
 Media related to San Jose del Monte at Wikimedia Commons
- Official website
- Philippine Standard Geographic Code
- San Jose del Monte City Bulacan
- Philippine Census Information
| show Places adjacent to San Jose del Monte |
|---|
| show Articles Related to San Jose del Monte |
|---|


| show Authority control |
|---|
- San Jose del Monte
- Cities in Bulacan
- Populated places established in 1752
- 1752 establishments in the Philippines
- Component cities in the Philippines