Xuyong County
Xuyong County
叙永县 | |
|---|---|
 Location of Xuyong County (red) within Luzhou City (yellow) and Sichuan | |
| Coordinates: 28°09′21″N 105°26′41″E / 28.1558°N 105.4448°ECoordinates: 28°09′21″N 105°26′41″E / 28.1558°N 105.4448°E | |
| Country | People's Republic of China |
| Province | Sichuan |
| Prefecture-level city | Luzhou |
| Area | |
| • Total | 2,977 km2 (1,149 sq mi) |
| Population (2018)[1] | |
| • Total | 582,000 |
| • Density | 200/km2 (510/sq mi) |
| Time zone | UTC+8 (China Standard) |

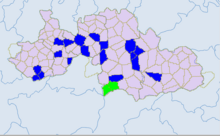
Ethnic townships in South Sichuan: Yibin and Luzhou. Light green -Yi. Blue - miao.
Xuyong County (simplified Chinese: 叙永县; traditional Chinese: 敘永縣; pinyin: Xùyǒng Xiàn) is a county in the southeast of Sichuan Province, China, bordering the provinces of Guizhou to the south and Yunnan to the west. It is under the administration of the prefecture-level city of Luzhou. The county covers 2,977 km2 (1,149 sq mi) with a population of 688,200 in 2007.[citation needed]
Climate[]
| showClimate data for Xuyong (1981−2010) |
|---|
See also[]
References[]
- ^ http://www.citypopulation.de/en/china/sichuan/admin/l%C3%BAzh%C5%8Du_sh%C3%AC/510524__x%C3%B9y%C5%8Fng_xi%C3%A0n/
- ^ 中国地面气候标准值月值(1981-2010) (in Chinese). China Meteorological Data Service Center. Retrieved 20 October 2018.
External links[]
| show Authority control |
|---|
This Sichuan location article is a stub. You can help Wikipedia by . |
Categories:
- County-level divisions of Sichuan
- Luzhou
- Sichuan geography stubs