2018 United States Senate elections
| ||||||||||||||||||||||||||||||||||||||||||||||||||||||||||||||||||||||||||
35 of the 100 seats in the United States Senate 51 seats needed for a majority | ||||||||||||||||||||||||||||||||||||||||||||||||||||||||||||||||||||||||||
|---|---|---|---|---|---|---|---|---|---|---|---|---|---|---|---|---|---|---|---|---|---|---|---|---|---|---|---|---|---|---|---|---|---|---|---|---|---|---|---|---|---|---|---|---|---|---|---|---|---|---|---|---|---|---|---|---|---|---|---|---|---|---|---|---|---|---|---|---|---|---|---|---|---|---|
| ||||||||||||||||||||||||||||||||||||||||||||||||||||||||||||||||||||||||||
  | ||||||||||||||||||||||||||||||||||||||||||||||||||||||||||||||||||||||||||


The 2018 United States Senate elections were held on November 6, 2018. 33 of the 100 seats were contested in regular elections while two others were contested in special elections due to Senate vacancies in Minnesota and Mississippi. The winners were elected to six-year terms running from January 3, 2019, to January 3, 2025. Senate Democrats had 26 seats up for election (including the seats of two independents who caucus with them) while Senate Republicans had nine seats up for election.
To maintain their working majority of 50 Senators and their party's Vice President's tie-breaking vote, Republicans could only afford a net loss of one seat in these elections. The Republicans had a 52-48 majority after the 2016 elections, but they lost a seat in Alabama in December 2017 after Jeff Sessions resigned to become Attorney General and a Democrat won in the subsequent special election. Three Republican-held seats were open as a result of retirements in Tennessee, Utah and Arizona. Although every Democratic incumbent ran for re-election, Democrats faced an extremely unfavorable map, defending 26 seats, of which 10 were in states won by Donald Trump in the 2016 presidential election, and five of those where Trump had won by more than ten percent. Republicans, however, only had to defend nine seats, of which only one was in a state won by Hillary Clinton in 2016.
The Democrats won the popular vote in this election cycle, receiving over 58%, but it was largely on account of two Democrats running in the California election. As a result, the Republicans increased their majority despite losing the popular vote, defeating Democratic incumbents in Florida, Indiana, Missouri, and North Dakota; and holding the open seats in Tennessee and Utah. In contrast, Democrats won two Republican-held seats, defeating an incumbent in Nevada and winning the open seat in Arizona.
The results for this election cycle were the only significant gains made by the Republicans in what was otherwise characterized as a "blue wave" election for the entire 2018 midterm cycle; the Democrats had simultaneously seized control of the United States House of Representatives from the Republicans, gained a number of key seats in the state governorships, and gained ground in the state legislatures and the attorney general offices. The Republican gains in the Senate and the Democratic gains in the House marked the first midterm election cycle since 1970 in which a sitting president's party made net gains in one chamber of Congress while suffering net losses in the other.[3]
Focus on competitive races[]
Democrats targeted Republican-held Senate seats in Arizona (open seat) and Nevada.[4] Seats in Texas,[5] Mississippi (at least one of the two seats) and Tennessee (open seat)[6] were also competitive for the Democrats. Republicans targeted Democratic-held seats in Indiana, Missouri, Montana, North Dakota and West Virginia, all of which had voted Republican in both the 2012 presidential election and the 2016 presidential election.[7] Seats in Florida, Ohio, Pennsylvania, Wisconsin and Michigan, all of which voted for Trump in 2016, were also targeted by Republicans.[4][8] The Democratic-held seat in New Jersey was also considered unexpectedly competitive due to corruption allegations surrounding the Democratic incumbent.
Partisan composition[]
Among the 33 Class 1 Senate seats up for regular election in 2018, twenty-three were held by Democrats, two by independents who caucused with the Senate Democrats and eight by Republicans. Class Two seats in Minnesota and Mississippi held by interim appointees were also up for election; both incumbent appointees sought election to finish their unexpired terms.
The map was widely characterized as extremely unfavorable to Democrats, as Democrats were defending 26 states while Republicans were defending nine. Of these seats, Democrats were defending ten in states won by Donald Trump in the 2016 presidential election, while Republicans were only defending one seat in a state won by Hillary Clinton in 2016.[9][10][11] According to FiveThirtyEight, Democrats faced the most unfavorable Senate map in 2018 that any party has ever faced in any election.[12][13]
The 2018 election cycle was the first midterm election cycle since 2002 in which any incumbents of the non-presidential party lost re-election. The number of defeated non-presidential party incumbents (4) was the most since the 1934 midterms.[14]
Results summary[]
| Parties | Total | ||||||||||||||||||||||||||||||||||||||||||||||||||||||||||||||||||||||||||||||||||||||||||||||||||
|---|---|---|---|---|---|---|---|---|---|---|---|---|---|---|---|---|---|---|---|---|---|---|---|---|---|---|---|---|---|---|---|---|---|---|---|---|---|---|---|---|---|---|---|---|---|---|---|---|---|---|---|---|---|---|---|---|---|---|---|---|---|---|---|---|---|---|---|---|---|---|---|---|---|---|---|---|---|---|---|---|---|---|---|---|---|---|---|---|---|---|---|---|---|---|---|---|---|---|---|
| Democratic | Republican | Independent | Libertarian | Green | Other | ||||||||||||||||||||||||||||||||||||||||||||||||||||||||||||||||||||||||||||||||||||||||||||||
| Last election (2016) | 46 | 52 | 2 | 0 | 0 | 0 | 100 | ||||||||||||||||||||||||||||||||||||||||||||||||||||||||||||||||||||||||||||||||||||||||||||
| Before these elections | 47 | 51 | 2 | 0 | 0 | 0 | 100 | ||||||||||||||||||||||||||||||||||||||||||||||||||||||||||||||||||||||||||||||||||||||||||||
| Not up | 23 | 42 | 0 | — | — | — | 65 | ||||||||||||||||||||||||||||||||||||||||||||||||||||||||||||||||||||||||||||||||||||||||||||
| Class 2 (2014→2020) | 11 | 20 | 0 | — | — | — | 31 | ||||||||||||||||||||||||||||||||||||||||||||||||||||||||||||||||||||||||||||||||||||||||||||
| Class 3 (2016→2022) | 12 | 22 | 0 | — | — | — | 34 | ||||||||||||||||||||||||||||||||||||||||||||||||||||||||||||||||||||||||||||||||||||||||||||
| Up | 24 | 9 | 2 | — | — | — | 35 | ||||||||||||||||||||||||||||||||||||||||||||||||||||||||||||||||||||||||||||||||||||||||||||
| Class 1 (2012→2018) | 23 | 8 | 2 | — | — | — | 33 | ||||||||||||||||||||||||||||||||||||||||||||||||||||||||||||||||||||||||||||||||||||||||||||
| Special: Class 2 | 1 | 1 | 0 | — | — | — | 2 | ||||||||||||||||||||||||||||||||||||||||||||||||||||||||||||||||||||||||||||||||||||||||||||
| Regular elections | |||||||||||||||||||||||||||||||||||||||||||||||||||||||||||||||||||||||||||||||||||||||||||||||||||
| Incumbent retired | 0 | 3 | 0 | — | — | — | 3 | ||||||||||||||||||||||||||||||||||||||||||||||||||||||||||||||||||||||||||||||||||||||||||||
| Held by same party | — | 2 | — | — | — | — | 2 | ||||||||||||||||||||||||||||||||||||||||||||||||||||||||||||||||||||||||||||||||||||||||||||
| Replaced by other party | 1 | ||||||||||||||||||||||||||||||||||||||||||||||||||||||||||||||||||||||||||||||||||||||||||||||||||
| Result | 1 | 2 | 0 | 0 | 0 | 0 | 3 | ||||||||||||||||||||||||||||||||||||||||||||||||||||||||||||||||||||||||||||||||||||||||||||
| Incumbent ran | 23 | 5 | 2 | — | — | — | 30 | ||||||||||||||||||||||||||||||||||||||||||||||||||||||||||||||||||||||||||||||||||||||||||||
| Won re-election | 19 | 4 | 2 | — | — | — | 25 | ||||||||||||||||||||||||||||||||||||||||||||||||||||||||||||||||||||||||||||||||||||||||||||
| Lost re-election | 5 | ||||||||||||||||||||||||||||||||||||||||||||||||||||||||||||||||||||||||||||||||||||||||||||||||||
| Result | 20 | 8 | 2 | 0 | 0 | 0 | 30 | ||||||||||||||||||||||||||||||||||||||||||||||||||||||||||||||||||||||||||||||||||||||||||||
| Special elections | |||||||||||||||||||||||||||||||||||||||||||||||||||||||||||||||||||||||||||||||||||||||||||||||||||
| Appointee ran | 1 | 1 | — | — | — | — | 2 | ||||||||||||||||||||||||||||||||||||||||||||||||||||||||||||||||||||||||||||||||||||||||||||
| Appointee elected | 1 | 1 | — | — | — | — | 2 | ||||||||||||||||||||||||||||||||||||||||||||||||||||||||||||||||||||||||||||||||||||||||||||
| Result | 1 | 1 | 0 | 0 | 0 | 0 | 2 | ||||||||||||||||||||||||||||||||||||||||||||||||||||||||||||||||||||||||||||||||||||||||||||
| Total elected | 22 | 11 | 2 | 0 | 0 | 0 | 35 | ||||||||||||||||||||||||||||||||||||||||||||||||||||||||||||||||||||||||||||||||||||||||||||
| Net gain/loss | 2 | ||||||||||||||||||||||||||||||||||||||||||||||||||||||||||||||||||||||||||||||||||||||||||||||||||
| Nationwide vote | 52,224,867 | 34,722,926 | 808,370 | 590,051 | 200,599 | 1,262,765 | 90,473,222 | ||||||||||||||||||||||||||||||||||||||||||||||||||||||||||||||||||||||||||||||||||||||||||||
| Share | 58.17% | 38.67% | 0.90% | 0.66% | 0.22% | 1.41% | 100% | ||||||||||||||||||||||||||||||||||||||||||||||||||||||||||||||||||||||||||||||||||||||||||||
| Result | 45 | 53 | 2 | 0 | 0 | 0 | 100 | ||||||||||||||||||||||||||||||||||||||||||||||||||||||||||||||||||||||||||||||||||||||||||||
Source: Clerk of the U.S. House of Representatives.[1]
Change in composition[]
Each block represents one of the one hundred seats in the Senate. "D#" is a Democratic senator, "I#" is an Independent senator and "R#" is a Republican senator. Arranged so parties are separated and a majority is clear by crossing the middle.
Before the elections[]
Each block indicates an incumbent senator's actions going into the election. Some "Ran" for re-election, some "Retired," and those without a note were not up for election this cycle. Before the elections, Republicans held 51 seats, Democrats held 47, and Independents held 2.
| D1 | D2 | D3 | D4 | D5 | D6 | D7 | D8 | D9 | D10 |
| D20 | D19 | D18 | D17 | D16 | D15 | D14 | D13 | D12 | D11 |
| D21 | D22 | D23 | D24 Calif. Ran |
D25 Conn. Ran |
D26 Del. Ran |
D27 Fla. Ran |
D28 Hawaii Ran |
D29 Ind. Ran |
D30 Md. Ran |
| D40 N.D. Ran |
D39 N.Y. Ran |
D38 N.M. Ran |
D37 N.J. Ran |
D36 Mont. Ran |
D35 Mo. Ran |
D34 Minn. (sp) Ran |
D33 Minn. (reg) Ran |
D32 Mich. Ran |
D31 Mass. Ran |
| D41 Ohio Ran |
D42 Penn. Ran |
D43 R.I. Ran |
D44 Va. Ran |
D45 Wash. Ran |
D46 W.Va. Ran |
D47 Wis. Ran |
I1 Maine Ran |
I2 Vt. Ran |
R51 Wyo. Ran |
| Majority → | |||||||||
| R41 | R42 | R43 Ariz. Retired |
R44 Miss. (reg) Ran |
R45 Miss. (sp) Ran |
R46 Neb. Ran |
R47 Nev. Ran |
R48 Tenn. Retired |
R49 Texas Ran |
R50 Utah Retired |
| R40 | R39 | R38 | R37 | R36 | R35 | R34 | R33 | R32 | R31 |
| R21 | R22 | R23 | R24 | R25 | R26 | R27 | R28 | R29 | R30 |
| R20 | R19 | R18 | R17 | R16 | R15 | R14 | R13 | R12 | R11 |
| R1 | R2 | R3 | R4 | R5 | R6 | R7 | R8 | R9 | R10 |
After the elections[]
Some senators were "Re-elected," some were a "Gain" in the seat from the other party (either by beating an incumbent or by winning an open seat), some were a "Hold" by the same party but with a different senator, and those without a note were not up for election this year.
After these elections, Democrats had 45 seats, independents had 2, and Republicans had 53.
| D1 | D2 | D3 | D4 | D5 | D6 | D7 | D8 | D9 | D10 |
| D20 | D19 | D18 | D17 | D16 | D15 | D14 | D13 | D12 | D11 |
| D21 | D22 | D23 | D24 Calif. Re-elected |
D25 Conn. Re-elected |
D26 Del. Re-elected |
D27 Hawaii Re-elected |
D28 Md. Re-elected |
D29 Mass. Re-elected |
D30 Mich. Re-elected |
| D40 Va. Re-elected |
D39 R.I. Re-elected |
D38 Pa. Re-elected |
D37 Ohio Re-elected |
D36 N.Y. Re-elected |
D35 N.M. Re-elected |
D34 N.J. Re-elected |
D33 Mont. Re-elected |
D32 Minn. (sp) Elected[d] |
D31 Minn. (reg) Re-elected |
| D41 Wash. Re-elected |
D42 W.Va. Re-elected |
D43 Wis. Re-elected |
D44 Ariz. Gain |
D45 Nev. Gain |
I1 Maine Re-elected |
I2 Vt. Re-elected |
R53 N.D. Gain |
R52 Mo. Gain |
R51 Ind. Gain |
| Majority → | |||||||||
| R41 | R42 | R43 Miss. (reg) Re-elected |
R44 Miss. (sp) Elected[d] |
R45 Neb. Re-elected |
R46 Tenn. Hold |
R47 Tex. Re-elected |
R48 Utah Hold |
R49 Wyo. Re-elected |
R50 Fla. Gain |
| R40 | R39 | R38 | R37 | R36 | R35 | R34 | R33 | R32 | R31 |
| R21 | R22 | R23 | R24 | R25 | R26 | R27 | R28 | R29 | R30 |
| R20 | R19 | R18 | R17 | R16 | R15 | R14 | R13 | R12 | R11 |
| R1 | R2 | R3 | R4 | R5 | R6 | R7 | R8 | R9 | R10 |
| Key: |
|
|---|
Final pre-election predictions[]
Several sites and individuals publish predictions of competitive seats. These predictions look at factors such as the strength of the incumbent (if the incumbent is running for reelection) and the other candidates, and the state's partisan lean (reflected in part by the state's Cook Partisan Voting Index rating). The predictions assign ratings to each seat, indicating the predicted advantage that a party has in winning that seat.
Most election predictors used:
- "tossup": no advantage
- "tilt" (used by some predictors): advantage that is not quite as strong as "lean"
- "lean": slight advantage
- "likely" or "favored": significant, but surmountable, advantage
- "safe" or "solid": near-certain chance of victory
| Constituency | Incumbent | 2018 election ratings | ||||||||||||
|---|---|---|---|---|---|---|---|---|---|---|---|---|---|---|
| State | PVI[15] | Senator | Last election[e] |
Cook Oct 26, 2018[16] |
IE Nov 1, 2018[17] |
Sabato Nov 5, 2018[18] |
NYT Nov 5, 2018[19] |
Fox News[f] Nov 5, 2018[20] |
CNN Nov 2, 2018[21] |
RCP Nov 5, 2018[22] |
Daily Kos Nov 5, 2018[23] |
Politico Nov 5, 2018[24] |
538[g] Nov 6, 2018[25] |
Result |
| Arizona | R+5 | Jeff Flake (retiring) |
49.2% R | Tossup | Tilt D (flip) | Lean D (flip) | Tossup | Tossup | Tossup | Tossup | Tossup | Tossup | Lean D (flip) | Sinema 50.0% D (flip) |
| California | D+12 | Dianne Feinstein | 62.5% D | Safe D | Safe D | Safe D | Safe D | Likely D | Safe D | Safe D | Safe D | Safe D | Safe D | Feinstein 54.2% D |
| Connecticut | D+6 | Chris Murphy | 59.5% D | Safe D | Safe D | Safe D | Safe D | Likely D | Safe D | Safe D | Safe D | Safe D | Safe D | Murphy 59.5% D |
| Delaware | D+6 | Tom Carper | 66.4% D | Safe D | Safe D | Safe D | Safe D | Likely D | Safe D | Safe D | Safe D | Safe D | Safe D | Carper 60.0% D |
| Florida | R+2 | Bill Nelson | 55.2% D | Tossup | Tilt D | Lean D | Tossup | Tossup | Tossup | Tossup | Tossup | Tossup | Lean D | Scott 50.1% R (flip) |
| Hawaii | D+18 | Mazie Hirono | 62.6% D | Safe D | Safe D | Safe D | Safe D | Likely D | Safe D | Safe D | Safe D | Safe D | Safe D | Hirono 72.7% D |
| Indiana | R+9 | Joe Donnelly | 50.0% D | Tossup | Tossup | Lean R (flip) | Tossup | Tossup | Tossup | Tossup | Tossup | Tossup | Lean D | Braun 50.7% R (flip) |
| Maine | D+3 | Angus King | 52.9% I | Safe D/I | Safe D/I | Safe D/I | Safe D/I | Likely D/I | Safe D/I | Safe D/I | Safe D/I | Safe D/I | Safe D/I | King 54.2% I |
| Maryland | D+12 | Ben Cardin | 56.0% D | Safe D | Safe D | Safe D | Safe D | Likely D | Safe D | Safe D | Safe D | Safe D | Safe D | Cardin 64.2% D |
| Massachusetts | D+12 | Elizabeth Warren | 53.7% D | Safe D | Safe D | Safe D | Safe D | Likely D | Safe D | Safe D | Safe D | Safe D | Safe D | Warren 60.5% D |
| Michigan | D+1 | Debbie Stabenow | 58.8% D | Likely D | Safe D | Safe D | Likely D | Likely D | Likely D | Lean D | Safe D | Likely D | Safe D | Stabenow 52.2% D |
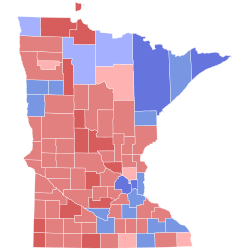
| Minnesota (Regular) |
D+1 | Amy Klobuchar | 65.2% D | Safe D | Safe D | Safe D | Safe D | Likely D | Safe D | Safe D | Safe D | Safe D | Safe D | Klobuchar 60.9% D |
| Minnesota (Special) |
D+1 | Tina Smith | Appointed (2018)[h] |
Lean D | Likely D | Likely D | Lean D | Likely D | Likely D | Lean D | Likely D | Likely D | Likely D | Smith 53.6% D |
| Mississippi (Regular) |
R+9 | Roger Wicker | 57.1% R | Safe R | Safe R | Safe R | Safe R | Likely R | Safe R | Safe R | Safe R | Safe R | Safe R | Wicker 58.9% R |
| Mississippi (Special)[i] |
R+9 | Cindy Hyde-Smith | Appointed (2018)[j] |
Lean R | Safe R | Likely R | Lean R | Lean R | Safe R | Likely R | Likely R | Likely R | Lean R | Hyde-Smith 53.6% R |
| Missouri | R+9 | Claire McCaskill | 54.8% D | Tossup | Tilt R (flip) | Lean R (flip) | Tossup | Tossup | Tossup | Tossup | Tossup | Tossup | Tossup | Hawley 51.9% R (flip) |
| Montana | R+11 | Jon Tester | 48.6% D | Tossup | Tilt D | Lean D | Tossup | Lean D | Lean D | Tossup | Tossup | Lean D | Likely D | Tester 50.3% D |
| Nebraska | R+14 | Deb Fischer | 57.8% R | Safe R | Safe R | Safe R | Safe R | Likely R | Safe R | Safe R | Safe R | Safe R | Safe R | Fischer 58.0% R |
| Nevada | D+1 | Dean Heller | 45.9% R | Tossup | Tilt D (flip) | Lean D (flip) | Tossup | Tossup | Tossup | Tossup | Tossup | Tossup | Tossup | Rosen 51.5% D (flip) |
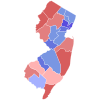
| New Jersey | D+7 | Bob Menendez | 58.9% D | Tossup | Likely D | Likely D | Tossup | Lean D | Lean D | Lean D | Lean D | Lean D | Likely D | Menendez 53.1% D |
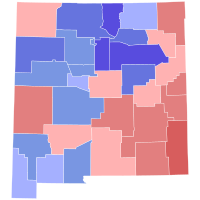
| New Mexico | D+3 | Martin Heinrich | 51.0% D | Safe D | Safe D | Safe D | Safe D | Likely D | Safe D | Safe D | Safe D | Safe D | Safe D | Heinrich 53.7% D |
| New York | D+11 | Kirsten Gillibrand | 72.2% D | Safe D | Safe D | Safe D | Safe D | Likely D | Safe D | Safe D | Safe D | Safe D | Safe D | Gillibrand 67.0% D |
| North Dakota | R+16 | Heidi Heitkamp | 50.2% D | Lean R (flip) | Lean R (flip) | Lean R (flip) | Lean R (flip) | Likely R (flip) | Lean R (flip) | Lean R (flip) | Lean R (flip) | Lean R (flip) | Lean R (flip) | Cramer 55.4% R (flip) |
| Ohio | R+3 | Sherrod Brown | 50.7% D | Likely D | Safe D | Likely D | Likely D | Likely D | Likely D | Lean D | Likely D | Likely D | Safe D | Brown 53.2% D |
| Pennsylvania | EVEN | Bob Casey Jr. | 53.7% D | Likely D | Safe D | Safe D | Likely D | Likely D | Likely D | Likely D | Safe D | Likely D | Safe D | Casey 55.6% D |
| Rhode Island | D+10 | Sheldon Whitehouse | 64.8% D | Safe D | Safe D | Safe D | Safe D | Likely D | Safe D | Safe D | Safe D | Safe D | Safe D | Whitehouse 61.5% D |
| Tennessee | R+14 | Bob Corker (retiring) |
64.9% R | Tossup | Lean R | Lean R | Tossup | Lean R | Tossup | Tossup | Lean R | Lean R | Likely R | Blackburn 54.4% R |
| Texas | R+8 | Ted Cruz | 56.5% R | Tossup | Likely R | Lean R | Tossup | Lean R | Lean R | Lean R | Lean R | Lean R | Likely R | Cruz 50.9% R |
| Utah | R+20 | Orrin Hatch (retiring) |
65.3% R | Safe R | Safe R | Safe R | Safe R | Likely R | Safe R | Safe R | Safe R | Safe R | Safe R | Romney 62.5% R |
| Vermont | D+15 | Bernie Sanders | 71.0% I | Safe D/I | Safe D/I | Safe D/I | Safe D/I | Likely D/I | Safe D/I | Safe D/I | Safe D/I | Safe D/I | Safe D/I | Sanders 67.4% I |
| Virginia | D+1 | Tim Kaine | 52.3% D | Safe D | Safe D | Safe D | Safe D | Likely D | Safe D | Safe D | Safe D | Safe D | Safe D | Kaine 56.9% D |
| Washington | D+7 | Maria Cantwell | 60.5% D | Safe D | Safe D | Safe D | Safe D | Likely D | Safe D | Safe D | Safe D | Safe D | Safe D | Cantwell 58.6% D |
| West Virginia | R+20 | Joe Manchin | 60.6% D | Lean D | Tilt D | Lean D | Lean D | Lean D | Lean D | Tossup | Lean D | Lean D | Likely D | Manchin 49.5% D |
| Wisconsin | EVEN | Tammy Baldwin | 51.4% D | Likely D | Safe D | Likely D | Likely D | Likely D | Likely D | Lean D | Likely D | Likely D | Safe D | Baldwin 54.9% D |
| Wyoming | R+25 | John Barrasso | 75.7% R | Safe R | Safe R | Safe R | Safe R | Likely R | Safe R | Safe R | Safe R | Safe R | Safe R | Barrasso 67.1% R |
| Overall[k] | D - 43 R - 48 9 tossups |
D - 48 R - 51 1 tossup |
D - 48 R - 52 0 tossups |
D - 43 R - 48 9 tossups |
D - 45 R - 50 5 tossups |
D - 45 R - 49 6 tossups |
D - 43 R - 49 8 tossups |
D - 44 R - 50 6 tossups |
D - 45 R - 50 5 tossups |
D - 48 R - 50 2 tossups |
Results: D - 47 R - 53 | |||
Election dates[]
These are the election dates for the regularly scheduled general elections.
| State | Filing deadline[26] |
Primary election[27] |
Primary run-off (if necessary)[27] |
General election |
Poll closing (Eastern Time)[28] |
|---|---|---|---|---|---|
| Arizona | May 30, 2018 | August 28, 2018 | N/A | November 6, 2018 | 9pm |
| California | March 9, 2018 | June 5, 2018 | N/A | November 6, 2018 | 11pm |
| Connecticut | June 12, 2018 | August 14, 2018 | N/A | November 6, 2018 | 8pm |
| Delaware | July 10, 2018 | September 6, 2018 | N/A | November 6, 2018 | 8pm |
| Florida | May 4, 2018 | August 28, 2018 | N/A | November 6, 2018 | 7pm and 8pm |
| Hawaii | June 5, 2018 | August 11, 2018 | N/A | November 6, 2018 | 11pm |
| Indiana | February 9, 2018 | May 8, 2018 | N/A | November 6, 2018 | 6pm and 7pm |
| Maine | March 15, 2018 | June 12, 2018 | N/A | November 6, 2018 | 8pm |
| Maryland | February 27, 2018 | June 26, 2018 | N/A | November 6, 2018 | 8pm |
| Massachusetts | June 5, 2018 | September 4, 2018 | N/A | November 6, 2018 | 8pm |
| Michigan | April 24, 2018 | August 7, 2018 | N/A | November 6, 2018 | 8pm and 9pm |
| Minnesota | June 5, 2018 | August 14, 2018 | N/A | November 6, 2018 | 9pm |
| Mississippi | March 1, 2018 | June 5, 2018 | June 26, 2018 | November 6, 2018 | 8pm |
| Mississippi (Special) | March 26, 2018 | November 6, 2018 | N/A | November 27, 2018[l] | 8pm |
| Missouri | March 27, 2018 | August 7, 2018 | N/A | November 6, 2018 | 8pm |
| Montana | March 12, 2018 | June 5, 2018 | N/A | November 6, 2018 | 10pm |
| Nebraska | March 1, 2018 | May 15, 2018 | N/A | November 6, 2018 | 9pm |
| Nevada | March 16, 2018 | June 12, 2018 | N/A | November 6, 2018 | 10pm |
| New Jersey | April 2, 2018 | June 5, 2018 | N/A | November 6, 2018 | 8pm |
| New Mexico | March 13, 2018 | June 5, 2018 | N/A | November 6, 2018 | 9pm |
| New York | April 12, 2018 | June 26, 2018 | N/A | November 6, 2018 | 9pm |
| North Dakota | April 9, 2018 | June 12, 2018 | N/A | November 6, 2018 | 8pm and 9pm |
| Ohio | February 7, 2018 | May 8, 2018 | N/A | November 6, 2018 | 7:30pm |
| Pennsylvania | March 20, 2018 | May 15, 2018 | N/A | November 6, 2018 | 8pm |
| Rhode Island | June 27, 2018 | September 12, 2018 | N/A | November 6, 2018 | 8pm |
| Tennessee | April 5, 2018 | August 2, 2018 | N/A | November 6, 2018 | 8pm |
| Texas | December 11, 2017 | March 6, 2018 | May 22, 2018 (unnecessary) |
November 6, 2018 | 8pm and 9pm |
| Utah | March 15, 2018 | June 26, 2018 | N/A | November 6, 2018 | 10pm |
| Vermont | May 31, 2018 | August 14, 2018 | N/A | November 6, 2018 | 7pm |
| Virginia | March 29, 2018 | June 12, 2018 | N/A | November 6, 2018 | 7pm |
| Washington | May 18, 2018 | August 7, 2018 | N/A | November 6, 2018 | 11pm |
| West Virginia | January 27, 2018 | May 8, 2018 | N/A | November 6, 2018 | 7:30pm |
| Wisconsin | June 1, 2018 | August 14, 2018 | N/A | November 6, 2018 | 9pm |
| Wyoming | June 1, 2018 | August 21, 2018 | N/A | November 6, 2018 | 9pm |
Race summary[]
Special elections during the preceding Congress[]
In these special elections, the winners will be seated before January 3, 2019, when elected and qualified. They are ordered by election date, then by state and by class.
| State (linked to summaries below) |
Incumbent | Results | Candidates | ||
|---|---|---|---|---|---|
| Senator | Party | Electoral history | |||
| Minnesota (Class 2) |
Tina Smith | Democratic | 2018 (Appointed) | Interim appointee elected. |
|
| Mississippi (Class 2) |
Cindy Hyde-Smith | Republican | 2018 (Appointed) | Interim appointee elected. | |
Elections leading to the next Congress[]
In these general elections, the winners were elected for the term beginning January 3, 2019.
All of the elections involve the Class 1 seats and they are ordered by state.
| State (linked to summaries below) |
Incumbent | Results | Candidates | ||
|---|---|---|---|---|---|
| Senator | Party | Electoral history | |||
| Arizona | Jeff Flake | Republican | 2012 | Incumbent retired. New senator elected. Democratic gain. |
|
| California | Dianne Feinstein | Democratic | 1992 (Special) 1994 2000 2006 2012 |
Incumbent re-elected. |
|
| Connecticut | Chris Murphy | Democratic | 2012 | Incumbent re-elected. |
|
| Delaware | Tom Carper | Democratic | 2000 2006 2012 |
Incumbent re-elected. |
|
| Florida | Bill Nelson | Democratic | 2000 2006 2012 |
Incumbent lost re-election. New senator elected. Republican gain. |
|
| Hawaii | Mazie Hirono | Democratic | 2012 | Incumbent re-elected. |
|
| Indiana | Joe Donnelly | Democratic | 2012 | Incumbent lost re-election. New senator elected. Republican gain. |
|
| Maine | Angus King | Independent | 2012 | Incumbent re-elected. |
|
| Maryland | Ben Cardin | Democratic | 2006 2012 |
Incumbent re-elected. |
|
| Massachusetts | Elizabeth Warren | Democratic | 2012 | Incumbent re-elected. |
|
| Michigan | Debbie Stabenow | Democratic | 2000 2006 2012 |
Incumbent re-elected. |
|
| Minnesota | Amy Klobuchar | DFL | 2006 2012 |
Incumbent re-elected. |
|
| Mississippi | Roger Wicker | Republican | 2007 (Appointed) 2008 (Special) 2012 |
Incumbent re-elected. |
|
| Missouri | Claire McCaskill | Democratic | 2006 2012 |
Incumbent lost re-election. New senator elected. Republican gain. |
|
| Montana | Jon Tester | Democratic | 2006 2012 |
Incumbent re-elected. |
|
| Nebraska | Deb Fischer | Republican | 2012 | Incumbent re-elected. |
|
| Nevada | Dean Heller | Republican | 2011 (Appointed) 2012 |
Incumbent lost re-election. New senator elected. Democratic gain. |
|
| New Jersey | Bob Menendez | Democratic | 2006 (Appointed) 2006 2012 |
Incumbent re-elected. |
|
| New Mexico | Martin Heinrich | Democratic | 2012 | Incumbent re-elected. |
|
| New York | Kirsten Gillibrand | Democratic | 2009 (Appointed) 2010 (Special) 2012 |
Incumbent re-elected. |
|
| North Dakota | Heidi Heitkamp | Democratic-NPL | 2012 | Incumbent lost re-election. New senator elected. Republican gain. |
|
| Ohio | Sherrod Brown | Democratic | 2006 2012 |
Incumbent re-elected. |
|
| Pennsylvania | Bob Casey Jr. | Democratic | 2006 2012 |
Incumbent re-elected. |
|
| Rhode Island | Sheldon Whitehouse | Democratic | 2006 2012 |
Incumbent re-elected. |
|
| Tennessee | Bob Corker | Republican | 2006 2012 |
Incumbent retired. New senator elected. Republican hold. |
|
| Texas | Ted Cruz | Republican | 2012 | Incumbent re-elected. |
|
| Utah | Orrin Hatch | Republican | 1976 1982 1988 1994 2000 2006 2012 |
Incumbent retired. New senator elected. Republican hold. |
|
| Vermont | Bernie Sanders | Independent | 2006 2012 |
Incumbent re-elected. |
|
| Virginia | Tim Kaine | Democratic | 2012 | Incumbent re-elected. |
|
| Washington | Maria Cantwell | Democratic | 2000 2006 2012 |
Incumbent re-elected. |
|
| West Virginia | Joe Manchin | Democratic | 2010 (Special) 2012 |
Incumbent re-elected. |
|
| Wisconsin | Tammy Baldwin | Democratic | 2012 | Incumbent re-elected. |
|
| Wyoming | John Barrasso | Republican | 2007 (Appointed) 2008 (Special) 2012 |
Incumbent re-elected. |
|
Closest races[]
In twelve races the margin of victory was under 10%.
| State | Party of winner | Margin |
|---|---|---|
| Florida | Republican (flip) | 0.12% |
| Arizona | Democratic (flip) | 2.34% |
| Texas | Republican | 2.57% |
| West Virginia | Democratic | 3.31% |
| Montana | Democratic | 3.55% |
| Nevada | Democratic (flip) | 5.03% |
| Missouri | Republican (flip) | 5.81% |
| Indiana | Republican (flip) | 5.89%[m] |
| Michigan | Democratic | 6.51% |
| Ohio | Democratic | 6.85% |
| Mississippi (Special) | Republican | 7.27% |
| California | Democratic | 8.33%[n] |
Arizona[]
| Turnout | 64.85% | ||||||||||||||||
|---|---|---|---|---|---|---|---|---|---|---|---|---|---|---|---|---|---|
| |||||||||||||||||
 County results | |||||||||||||||||
| |||||||||||||||||


One-term Republican Jeff Flake was elected with 49% of the vote in 2012. He chose not to run for reelection.[30]
U.S. Representative Martha McSally[31] won the Republican nomination in a three-way primary on August 28, 2018, against Joe Arpaio and Kelli Ward.
U.S. Representative Kyrsten Sinema[31] easily secured the Democratic nomination.
Sinema defeated McSally by a slim margin; her victory became official only after six days of counting ballots.
| Party | Candidate | Votes | % | |
|---|---|---|---|---|
| Republican | Martha McSally | 357,626 | 54.57 | |
| Republican | Kelli Ward | 180,926 | 27.61 | |
| Republican | Joe Arpaio | 116,555 | 17.79 | |
| Write-in | 191 | 0.03 | ||
| Total votes | 655,298 | 100.00 | ||
| Party | Candidate | Votes | % | |
|---|---|---|---|---|
| Democratic | Kyrsten Sinema | 404,170 | 79.25 | |
| Democratic | Deedra Abboud | 105,800 | 20.75 | |
| Total votes | 509,970 | 100.00 | ||
| Party | Candidate | Votes | % | |
|---|---|---|---|---|
| Democratic | Kyrsten Sinema | 1,191,100 | 49.96 | |
| Republican | Martha McSally | 1,135,200 | 47.61 | |
| Green | Angela Green | 57,442 | 2.41 | |
| Write-in | 566 | 0.02 | ||
| Total votes | 2,384,308 | 100.00 | ||
| Democratic gain from Republican | ||||
California[]
| Turnout | 56.42% | ||||||||||||||||
|---|---|---|---|---|---|---|---|---|---|---|---|---|---|---|---|---|---|
| |||||||||||||||||
 County results | |||||||||||||||||
| |||||||||||||||||


Four-term Democrat Dianne Feinstein won a special election in 1992 and was elected to full terms in 1994, 2000, 2006, and 2012. She ran for re-election and advanced to the general election after securing the top spot in the June 5 jungle primary.[33]
The June 5 primary ballot listed 32 candidates (Feinstein plus 31 challengers) in addition to 3 write-in candidates. There were 10 Democratic candidates, 11 Republican candidates, one Libertarian, one Peace and Freedom candidate, and 9 independent candidates. There was also a Green Party candidate who ran as a write-in.
President pro tempore of the California State Senate Kevin de León advanced to the general election for the right to challenge Feinstein after securing the second spot in the primary.[33]
The 11 Republican candidates who ran in the primary combined for 33.2% of the vote. The top Republican candidate, James P. Bradley, received 8.3% of the vote, which put him in 3rd place at 3.8% behind the second-place finisher, Kevin DeLeon.[34]
On November 6, Dianne Feinstein was elected to a fifth term, defeating Kevin de León.
| Party | Candidate | Votes | % | |
|---|---|---|---|---|
| Democratic | Dianne Feinstein (incumbent) | 2,947,035 | 44.18 | |
| Democratic | Kevin de León | 805,446 | 12.07 | |
| Republican | James P. Bradley | 556,252 | 8.34 | |
| Republican | Arun K. Bhumitra | 350,815 | 5.26 | |
| Republican | Paul A. Taylor | 323,534 | 4.85 | |
| Republican | Erin Cruz | 267,494 | 4.01 | |
| Republican | Tom Palzer | 205,183 | 3.08 | |
| Democratic | Alison Hartson | 147,061 | 2.20 | |
| Republican | Rocky De La Fuente | 135,279 | 2.03 | |
| Democratic | Pat Harris | 126,947 | 1.90 | |
| Republican | John "Jack" Crew | 93,808 | 1.41 | |
| Republican | Patrick Little | 89,867 | 1.35 | |
| Republican | Kevin Mottus | 87,646 | 1.31 | |
| Republican | Jerry Joseph Laws | 67,140 | 1.01 | |
| Libertarian | Derrick Michael Reid | 60,000 | 0.90 | |
| Democratic | Adrienne Nicole Edwards | 56,172 | 0.84 | |
| Democratic | Douglas Howard Pierce | 42,671 | 0.64 | |
| Republican | Mario Nabliba | 39,209 | 0.59 | |
| Democratic | David Hildebrand | 30,305 | 0.45 | |
| Democratic | Donnie O. Turner | 30,101 | 0.45 | |
| Democratic | Herbert G. Peters | 27,468 | 0.41 | |
| No party preference | David Moore | 24,614 | 0.37 | |
| No party preference | Ling Ling Shi | 23,506 | 0.35 | |
| Peace and Freedom | John Thompson Parker | 22,825 | 0.34 | |
| No party preference | Lee Olson | 20,393 | 0.31 | |
| Democratic | Gerald Plummer | 18,234 | 0.27 | |
| No party preference | Jason M. Hanania | 18,171 | 0.27 | |
| No party preference | Don J. Grundmann | 15,125 | 0.23 | |
| No party preference | Colleen Shea Fernald | 13,536 | 0.20 | |
| No party preference | Rash Bihari Ghosh | 12,557 | 0.19 | |
| No party preference | Tim Gildersleeve | 8,482 | 0.13 | |
| No party preference | Michael Fahmy Girgis | 2,986 | 0.04 | |
| Write-in | 863 | 0.01 | ||
| Total votes | 6,670,720 | 100.00 | ||
| Party | Candidate | Votes | % | |
|---|---|---|---|---|
| Democratic | Dianne Feinstein (incumbent) | 6,019,422 | 54.16 | |
| Democratic | Kevin de León | 5,093,942 | 45.84 | |
| Total votes | 11,113,364 | 100.00 | ||
| Democratic hold | ||||
Connecticut[]
| Turnout | 63.58% | ||||||||||||||||
|---|---|---|---|---|---|---|---|---|---|---|---|---|---|---|---|---|---|
| |||||||||||||||||
 County results | |||||||||||||||||
| |||||||||||||||||


One-term Democrat Chris Murphy was elected with 55% of the vote in 2012. He ran for re-election.[35]
Businessmen Matthew Corey[36] received the Republican nomination.
Chris Murphy was elected to a second term, winning nearly 60% of the vote.[37]
| Party | Candidate | Votes | % | |
|---|---|---|---|---|
| Republican | Matthew Corey | 99,899 | 76.54 | |
| Republican | Dominic Rapini | 30,624 | 23.46 | |
| Total votes | 130,523 | 100.00 | ||
| Party | Candidate | Votes | % | |
|---|---|---|---|---|
| Democratic | Chris Murphy | 787,685 | 56.80 | |
| Working Families | Chris Murphy | 37,894 | 2.73 | |
| Total | Chris Murphy (incumbent) | 825,579 | 59.53 | |
| Republican | Matthew Corey | 545,717 | 39.35 | |
| Libertarian | Richard Lion | 8,838 | 0.64 | |
| Green | Jeff Russell | 6,618 | 0.48 | |
| Write-in | 88 | 0.01 | ||
| Total votes | 1,386,840 | 100.00 | ||
| Democratic hold | ||||
Delaware[]
| Turnout | 52.18% | ||||||||||||||||
|---|---|---|---|---|---|---|---|---|---|---|---|---|---|---|---|---|---|
| |||||||||||||||||
 County results | |||||||||||||||||
| |||||||||||||||||

Three-term Democrat Tom Carper won re-election with 66% of the vote in 2012. He announced he was running for re-election during an interview on MSNBC on July 24, 2017.[38] He defeated Dover community activist Kerri Evelyn Harris for the Democratic nomination. Sussex County Councilman Robert Arlett won the Republican nomination.[38]
Tom Carper defeated Arlett, winning 60% of the vote.[39]
| Party | Candidate | Votes | % | |
|---|---|---|---|---|
| Democratic | Tom Carper (incumbent) | 53,635 | 64.59 | |
| Democratic | Kerri Evelyn Harris | 29,407 | 35.41 | |
| Total votes | 83,042 | 100.00 | ||
| Party | Candidate | Votes | % | |
|---|---|---|---|---|
| Republican | Rob Arlett | 25,284 | 66.77 | |
| Republican | Gene Truono | 10,587 | 27.96 | |
| Republican | Rocky De La Fuente | 1,998 | 5.28 | |
| Total votes | 37,870 | 100.00 | ||
| Party | Candidate | Votes | % | |
|---|---|---|---|---|
| Democratic | Tom Carper (incumbent) | 217,385 | 59.95 | |
| Republican | Rob Arlett | 137,127 | 37.82 | |
| Green | Demitri Theodoropoulos | 4,170 | 1.15 | |
| Libertarian | Nadine Frost | 3,910 | 1.08 | |
| Write-in | 14 | 0.00 | ||
| Total votes | 362,606 | 100.00 | ||
| Democratic hold | ||||
Florida[]
| Turnout | 61.68% | ||||||||||||||||
|---|---|---|---|---|---|---|---|---|---|---|---|---|---|---|---|---|---|
| |||||||||||||||||
 County results | |||||||||||||||||
| |||||||||||||||||


Three-term Democrat Bill Nelson was re-elected with 55% of the vote in 2012. He sought re-election to a fourth term in office.[40]
Florida Governor Rick Scott won the Republican nomination. First elected in 2010 and re-elected in 2014, Scott's term as Governor of Florida was set to end by January 2019, due to term limits.[40]
Edward Janowski was running as an independent, but did not qualify.[40]
Scott led among ballots tallied on election night, but given the close margins of the race recounts were ordered.[41] Final recount numbers were released following a machine and hand recount with Rick Scott maintaining a lead.[42] On November 18, Nelson conceded to Scott.[43] Two days later, election results were certified by the state, cementing Scott's win.[44]
| Party | Candidate | Votes | % | |
|---|---|---|---|---|
| Republican | Rick Scott | 1,456,187 | 88.61 | |
| Republican | Rocky De La Fuente | 187,209 | 11.39 | |
| Total votes | 1,643,396 | 100.00 | ||
| Party | Candidate | Votes | % | |
|---|---|---|---|---|
| Republican | Rick Scott | 4,099,505 | 50.05 | |
| Democratic | Bill Nelson (incumbent) | 4,089,472 | 49.93 | |
| Write-in | 1,028 | 0.01 | ||
| Total votes | 8,190,005 | 100.00 | ||
| Republican gain from Democratic | ||||
Hawaii[]
| Turnout | 51.32% | ||||||||||||||||
|---|---|---|---|---|---|---|---|---|---|---|---|---|---|---|---|---|---|
| |||||||||||||||||
 County results | |||||||||||||||||
| |||||||||||||||||

One-term Democrat Mazie Hirono was elected with 63% of the vote in 2012. She ran.[45]
Ron Curtis was the Republican nominee.
Hirono was elected to a second term by a landslide.
| Party | Candidate | Votes | % | |
|---|---|---|---|---|
| Democratic | Mazie Hirono (incumbent) | 201,679 | 100.00 | |
| Total votes | 201,679 | 100.00 | ||
| Party | Candidate | Votes | % | |
|---|---|---|---|---|
| Republican | Ron Curtis | 6,370 | 23.73 | |
| Republican | Consuelo Anderson | 5,172 | 19.26 | |
| Republican | Robert C. Helsham Sr. | 3,988 | 14.85 | |
| Republican | Thomas E. White | 3,661 | 13.64 | |
| Republican | Rocky De La Fuente | 3,065 | 11.42 | |
| Republican | George L. Berish | 1,658 | 6.18 | |
| Republican | Michael R. Hodgkiss | 1,576 | 5.87 | |
| Republican | Eddie Pirkowski | 1,358 | 5.06 | |
| Total votes | 26,848 | 100.00 | ||
| Party | Candidate | Votes | % | |
|---|---|---|---|---|
| Democratic | Mazie Hirono (incumbent) | 276,316 | 71.15 | |
| Republican | Ron Curtis | 112,035 | 28.85 | |
| Total votes | 388,351 | 100.00 | ||
| Democratic hold | ||||
Indiana[]
| Turnout | 50.42% | ||||||||||||||||
|---|---|---|---|---|---|---|---|---|---|---|---|---|---|---|---|---|---|
| |||||||||||||||||
 County results | |||||||||||||||||
| |||||||||||||||||


One-term Democrat Joe Donnelly was elected with 50.04% of the vote in 2012. He ran. He won the Democratic primary unopposed.[46]
State Representative Mike Braun[46] won the May 8 Republican primary. U.S. Representatives Luke Messer[47] and Todd Rokita[47] also ran for the Republican nomination.
James Johnson ran as an independent.[46]
Braun won election with 51% of the vote, defeating Joe Donnelly.[48]
| Party | Candidate | Votes | % | |
|---|---|---|---|---|
| Democratic | Joe Donnelly (incumbent) | 284,621 | 100.00 | |
| Total votes | 284,621 | 100.00 | ||
| Party | Candidate | Votes | % | |
|---|---|---|---|---|
| Republican | Mike Braun | 208,602 | 41.17 | |
| Republican | Todd Rokita | 151,967 | 29.99 | |
| Republican | Luke Messer | 146,131 | 28.84 | |
| Total votes | 506,700 | 100.00 | ||
| Party | Candidate | Votes | % | |
|---|---|---|---|---|
| Republican | Mike Braun | 1,158,000 | 50.73 | |
| Democratic | Joe Donnelly (incumbent) | 1,023,553 | 44.84 | |
| Libertarian | Lucy Brenton | 100,942 | 4.42 | |
| Write-in | 70 | 0.00 | ||
| Total votes | 2,282,565 | 100.00 | ||
| Republican gain from Democratic | ||||
Maine[]
| Turnout | 59.96% | ||||||||||||||||||||
|---|---|---|---|---|---|---|---|---|---|---|---|---|---|---|---|---|---|---|---|---|---|
| |||||||||||||||||||||
 County results | |||||||||||||||||||||
| |||||||||||||||||||||


One-term Independent Senator Angus King was elected in a three-way race with 53% of the vote in 2012. King has caucused with the Democratic Party since taking office in 2013, but he has left open the possibility of caucusing with the Republican Party in the future.[49]
King ran.[50]
State Senator Eric Brakey ran unopposed for the Republican nomination.[50]
Public school teacher and founder of UClass Zak Ringelstein ran unopposed for the Democratic nomination.[50]
The election was conducted with ranked choice voting, as opposed to "First-past-the-post voting", after Maine voters passed a citizen referendum approving the change in 2016[51] and a June 2018 referendum sustaining the change.[52]
King was easily re-elected with over 50% of the vote.
| Party | Candidate | Votes | % | |
|---|---|---|---|---|
| Democratic | Zak Ringelstein | 89,841 | 100.00 | |
| Total votes | 89,841 | 100.00 | ||
| Party | Candidate | Votes | % | |
|---|---|---|---|---|
| Republican | Eric Brakey | 59,853 | 100.00 | |
| Total votes | 59,853 | 100.00 | ||
| Party | Candidate | Votes | % | |
|---|---|---|---|---|
| Independent | Angus King (incumbent) | 344,575 | 54.31 | |
| Republican | Eric Brakey | 223,502 | 35.23 | |
| Democratic | Zak RIngelstein | 66,268 | 10.45 | |
| Write-in | 64 | 0.01 | ||
| Total votes | 634,409 | 100.00 | ||
| Independent hold | ||||
Maryland[]
| Turnout | 58.17% | ||||||||||||||||
|---|---|---|---|---|---|---|---|---|---|---|---|---|---|---|---|---|---|
| |||||||||||||||||
 County results | |||||||||||||||||
| |||||||||||||||||


Two-term Democrat Ben Cardin was re-elected with 56% of the vote in 2012. He won the Democratic primary.[53]
Tony Campbell, Evan Cronhardt, Nnabu Eze, Gerald Smith, and Blaine Taylor[54] were seeking the Republican nomination, with Campbell winning.
Arvin Vohra, vice chairman of the Libertarian National Committee, sought the Libertarian Party nomination.[54]
Independents Neal Simon[54] and Edward Shlikas[citation needed], and Michael B Puskar ran.
Cardin won re-election to a third term in office.[55]
| Party | Candidate | Votes | % | |
|---|---|---|---|---|
| Democratic | Ben Cardin (incumbent) | 477,441 | 80.28 | |
| Democratic | Chelsea Manning | 34,611 | 5.82 | |
| Democratic | Jerome Segal | 20,027 | 3.37 | |
| Democratic | Debbie Wilson | 18,953 | 3.19 | |
| Democratic | Marcia H. Morgan | 16,047 | 2.70 | |
| Democratic | Lih Young | 9,874 | 1.66 | |
| Democratic | Richard Vaughn | 9,480 | 1.59 | |
| Democratic | Erik Jetmir | 8,259 | 1.39 | |
| Total votes | 594,692 | 100.00 | ||
| Party | Candidate | Votes | % | |
|---|---|---|---|---|
| Republican | Tony Campbell | 51,426 | 29.22 | |
| Republican | Chris Chaffee | 42,328 | 24.05 | |
| Republican | Christina J. Grigorian | 30,756 | 17.48 | |
| Republican | John Graziani | 15,435 | 8.77 | |
| Republican | Blaine Taylor | 8,848 | 5.03 | |
| Republican | Gerald I. Smith Jr. | 7,564 | 4.30 | |
| Republican | Brian Charles Vaeth | 5,411 | 3.07 | |
| Republican | Evan M. Cronhardt | 4,445 | 2.53 | |
| Republican | Bill Krehnbrink | 3,606 | 2.05 | |
| Republican | Nnabu Eze | 3,442 | 1.96 | |
| Republican | Albert Binyahmin Howard | 2,720 | 1.55 | |
| Total votes | 175,981 | 100.00 | ||
| Party | Candidate | Votes | % | |
|---|---|---|---|---|
| Democratic | Ben Cardin (incumbent) | 1,491,614 | 64.86 | |
| Republican | Tony Campbell | 697,017 | 30.31 | |
| Independent | Neal Simon | 85,964 | 3.74 | |
| Libertarian | Arvin Vohra | 22,943 | 1.00 | |
| Write-in | 2,351 | 0.10 | ||
| Total votes | 2,299,889 | 100.00 | ||
| Democratic hold | ||||
Massachusetts[]
| Turnout | 59.17% | ||||||||||||||||
|---|---|---|---|---|---|---|---|---|---|---|---|---|---|---|---|---|---|
| |||||||||||||||||
 Municipal results | |||||||||||||||||
| |||||||||||||||||

One-term Democrat Elizabeth Warren was elected with 54% of the vote in 2012. She ran for re-election.[56]
State Representative Geoff Diehl,[57] attorney and founder of Better for America, John Kingston[57] and former Romney aide Beth Lindstrom,[57] ran for the Republican nomination. Diehl won the Republican nomination.
Shiva Ayyadurai[58] ran as an independent. Shiva started as in early 2017 as the first Republican in the race, but went independent in November 2017.
Warren defeated Diehl, winning a second term.[59]
| Party | Candidate | Votes | % | |
|---|---|---|---|---|
| Democratic | Elizabeth Warren (incumbent) | 590,835 | 98.08 | |
| Write-in | 11,558 | 1.92 | ||
| Total votes | 602,393 | 100.00 | ||
| Party | Candidate | Votes | % | |
|---|---|---|---|---|
| Republican | Geoff Diehl | 144,043 | 55.15 | |
| Republican | John Kingston III | 69,636 | 26.66 | |
| Republican | Beth Joyce Lindstrom | 46,693 | 17.88 | |
| Write-in | 798 | 0.31 | ||
| Total votes | 261,170 | 100.00 | ||
| Party | Candidate | Votes | % | |
|---|---|---|---|---|
| Democratic | Elizabeth Warren (incumbent) | 1,633,371 | 60.34 | |
| Republican | Geoff Diehl | 979,210 | 36.17 | |
| Independent | Shiva Ayyadurai | 91,710 | 3.39 | |
| Write-in | 2,799 | 0.10 | ||
| Total votes | 2,707,090 | 100.00 | ||
| Democratic hold | ||||
Michigan[]
| Turnout | 56.72% | ||||||||||||||||
|---|---|---|---|---|---|---|---|---|---|---|---|---|---|---|---|---|---|
| |||||||||||||||||
 County results | |||||||||||||||||
| |||||||||||||||||


Three-term Democrat Debbie Stabenow was re-elected with 59% of the vote in 2012.[60] She was renominated without Democratic opposition. On the Republican side, businessman John James won the nomination.[60]
In the final months of the election, polls showed the race was beginning to narrow. Ultimately, Stabenow was re-elected, defeating James, with a majority of the vote.
| Party | Candidate | Votes | % | |
|---|---|---|---|---|
| Democratic | Debbie Stabenow (incumbent) | 1,045,450 | 100.00 | |
| Total votes | 1,045,450 | 100.00 | ||
| Party | Candidate | Votes | % | |
|---|---|---|---|---|
| Republican | John James | 518,564 | 54.67 | |
| Republican | Sandy Pensler | 429,885 | 45.32 | |
| Write-in | 57 | 0.01 | ||
| Total votes | 948,506 | 100.00 | ||
| Party | Candidate | Votes | % | |
|---|---|---|---|---|
| Democratic | Debbie Stabenow (incumbent) | 2,214,478 | 52.26 | |
| Republican | John James | 1,938,818 | 45.76 | |
| Green | Marcia Squier | 40,204 | 0.95 | |
| U.S. Taxpayers | George Huffman III | 27,251 | 0.64 | |
| Natural Law | John Howard Wilhelm | 16,502 | 0.39 | |
| Write-in | 18 | 0.00 | ||
| Total votes | 4,237,271 | 100.00 | ||
| Democratic hold | ||||
Minnesota[]
Minnesota (Regular)[]
| Turnout | 63.89% | ||||||||||||||||
|---|---|---|---|---|---|---|---|---|---|---|---|---|---|---|---|---|---|
| |||||||||||||||||
 County results | |||||||||||||||||
| |||||||||||||||||


Two-term Democrat Amy Klobuchar was re-elected with 65% of the vote in 2012. She ran for re-election.[61]
State Representative Jim Newberger[61] ran for the Republican nomination.
Klobuchar was easily re-elected.[62]
| Party | Candidate | Votes | % | |
|---|---|---|---|---|
| Democratic (DFL) | Amy Klobuchar (incumbent) | 557,306 | 95.70 | |
| Democratic (DFL) | Steve Carlson | 9,934 | 1.71 | |
| Democratic (DFL) | Stephen A. Emery | 7,047 | 1.21 | |
| Democratic (DFL) | David Robert Groves | 4,511 | 0.77 | |
| Democratic (DFL) | Leonard J. Richards | 3,552 | 0.61 | |
| Total votes | 582,350 | 100.00 | ||
| Party | Candidate | Votes | % | |
|---|---|---|---|---|
| Republican | Jim Newberger | 201,531 | 69.50 | |
| Republican | Merrill Anderson | 45,492 | 15.69 | |
| Republican | Rae Hart Anderon | 25,883 | 8.93 | |
| Republican | Rocky De La Fuente | 17,051 | 5.88 | |
| Total votes | 289,957 | 100.00 | ||
| Party | Candidate | Votes | % | |
|---|---|---|---|---|
| Democratic (DFL) | Amy Klobuchar (incumbent) | 1,566,174 | 60.31 | |
| Republican | Jim Newberger | 940,437 | 36.21 | |
| Legal Marijuana Now | Dennis Schuller | 66,236 | 2.55 | |
| Green | Paula M. Overby | 23,101 | 0.89 | |
| Write-in | 931 | 0.04 | ||
| Total votes | 2,596,879 | 100.00 | ||
| Democratic (DFL) hold | ||||
Minnesota (Special)[]
| Turnout | 63.66% | ||||||||||||||||
|---|---|---|---|---|---|---|---|---|---|---|---|---|---|---|---|---|---|
| |||||||||||||||||
 County results | |||||||||||||||||
| |||||||||||||||||


Two-term Democrat Al Franken announced that he would resign in December 2017, following allegations of sexual harassment. Mark Dayton, Governor of Minnesota, appointed Lt. Gov. Tina Smith on January 2, 2018, as an interim Senator until the November 2018 election. She defeated primary challenger Richard Painter in the Democratic primary held on August 14.
Incumbent Tina Smith defeated Republican Karin Housley in the general election to finish the term ending January 3, 2021.
| Party | Candidate | Votes | % | |
|---|---|---|---|---|
| Democratic (DFL) | Tina Smith (incumbent) | 433,705 | 76.06 | |
| Democratic (DFL) | Richard Painter | 78,193 | 13.71 | |
| Democratic (DFL) | Ali Chehem Ali | 18,897 | 3.31 | |
| Democratic (DFL) | Gregg A. Iverson | 17,825 | 3.13 | |
| Democratic (DFL) | Nick Leonard | 16,529 | 2.90 | |
| Democratic (DFL) | Christopher Lovell Seymore Sr. | 5,041 | 0.88 | |
| Total votes | 570,190 | 100.00 | ||
| Party | Candidate | Votes | % | |
|---|---|---|---|---|
| Republican | Karin Housley | 186,384 | 61.95 | |
| Republican | Bob Anderson | 107,102 | 35.60 | |
| Republican | Nikolay Nikolayevich Bey | 7,375 | 2.45 | |
| Total votes | 300,861 | 100.00 | ||
| Party | Candidate | Votes | % | |
|---|---|---|---|---|
| Democratic (DFL) | Tina Smith (incumbent) | 1,370,540 | 52.97 | |
| Republican | Karin Housley | 1,095,777 | 42.35 | |
| Legal Marijuana Now | Sarah Wellington | 95,614 | 3.70 | |
| Independent | Jerry Trooien | 24,324 | 0.94 | |
| Write-in | 1,101 | 0.04 | ||
| Total votes | 2,587,356 | 100.00 | ||
| Democratic (DFL) hold | ||||
Mississippi[]
Mississippi (Regular)[]
| Turnout | 49.66% | ||||||||||||||||
|---|---|---|---|---|---|---|---|---|---|---|---|---|---|---|---|---|---|
| |||||||||||||||||
 County results | |||||||||||||||||
| |||||||||||||||||


One-term Republican Roger Wicker won re-election with 57% of the vote in 2012. He was appointed in 2007 and won a special election in 2008 to serve the remainder of Trent Lott's term. He ran.[29]
David Baria[29] won the Democratic nomination in a run-off on June 26.
Wicker was easily re-elected.[63]
| Party | Candidate | Votes | % | |
|---|---|---|---|---|
| Republican | Roger Wicker (incumbent) | 130,118 | 82.79 | |
| Republican | Richard Boyanton | 27,052 | 17.21 | |
| Total votes | 157,170 | 100.00 | ||
| Party | Candidate | Votes | % | |
|---|---|---|---|---|
| Democratic | Howard Sherman | 27,957 | 31.79 | |
| Democratic | David Baria | 27,244 | 30.98 | |
| Democratic | Omeria Scott | 21,278 | 24.20 | |
| Democratic | Victor G. Maurice Jr. | 4,361 | 4.96 | |
| Democratic | Jerome Garland | 4,266 | 4.85 | |
| Democratic | Jensen Bohren | 2,825 | 3.21 | |
| Total votes | 87,931 | 100.00 | ||
| Party | Candidate | Votes | % | |
|---|---|---|---|---|
| Democratic | David Baria | 44,156 | 58.64 | |
| Democratic | Howard Sherman | 31,149 | 41.36 | |
| Total votes | 75,305 | 100.00 | ||
| Party | Candidate | Votes | % | |
|---|---|---|---|---|
| Republican | Roger Wicker (incumbent) | 547,619 | 58.49 | |
| Democratic | David Baria | 369,567 | 39.47 | |
| Libertarian | Danny Bedwell | 12,981 | 1.39 | |
| Reform | Shawn O'Hara | 6,048 | 0.65 | |
| Total votes | 936,215 | 100.00 | ||
| Republican hold | ||||
Mississippi (Special)[]
| |||||||||||||||||
| Turnout | 50.15% (general) / 48.14% (runoff) | ||||||||||||||||
|---|---|---|---|---|---|---|---|---|---|---|---|---|---|---|---|---|---|
| |||||||||||||||||
 County results | |||||||||||||||||
| |||||||||||||||||


Seven-term Republican Thad Cochran, who won re-election with 59.9% of the vote in 2014, announced that he would resign since April 1, 2018 due to health reasons.[64] Phil Bryant, Governor of Mississippi, announced on March 21, 2018, that he would appoint Mississippi Agriculture Commissioner Cindy Hyde-Smith to fill the vacancy.[65] She ran in the special election.[29]
On November 6, a nonpartisan jungle primary took place on the same day as the regularly scheduled U.S. Senate election for the seat currently held by Roger Wicker. Party affiliations were not printed on the ballot.[66] As no candidate gained 50% of the votes, a runoff special election between the top two candidates - Hyde-Smith and former United States Secretary of Agriculture Mike Espy[29] - was held on November 27, 2018. Hyde-Smith won the runoff election.
Democrat Tobey Bartee[67] and Republican Chris McDaniel also contested the first round of the election.[29]
| Party | Candidate | Votes | % | |
|---|---|---|---|---|
| Nonpartisan | Cindy Hyde-Smith (incumbent) | 389,995 | 41.25 | |
| Nonpartisan | Mike Espy | 386,742 | 40.90 | |
| Nonpartisan | Chris McDaniel | 154,878 | 16.38 | |
| Nonpartisan | Tobey Bernard Bartee | 13,852 | 1.47 | |
| Total votes | 945,467 | 100.00 | ||
| Party | Candidate | Votes | % | |
|---|---|---|---|---|
| Nonpartisan | Cindy Hyde-Smith (incumbent) | 486,769 | 53.63 | |
| Nonpartisan | Mike Espy | 420,819 | 46.37 | |
| Total votes | 907,588 | 100.00 | ||
| Republican hold | ||||
Missouri[]
| Turnout | 58.23% | ||||||||||||||||
|---|---|---|---|---|---|---|---|---|---|---|---|---|---|---|---|---|---|
| |||||||||||||||||
 County results | |||||||||||||||||
| |||||||||||||||||


Two-term Democrat Claire McCaskill was re-elected with 55% of the vote in 2012. She was renominated.[68]
Attorney General Josh Hawley[68] won the Republican nomination.[citation needed] Japheth Campbell declared his candidacy for the Libertarian nomination.[68]
Polls showed a close race for months leading up to the election. Hawley defeated McCaskill in the general election.[69]
| Party | Candidate | Votes | % | |
|---|---|---|---|---|
| Democratic | Claire McCaskill (incumbent) | 501,872 | 82.60 | |
| Democratic | Carla Wright | 41,126 | 6.77 | |
| Democratic | David Faust | 15,984 | 2.63 | |
| Democratic | John Hogan | 15,958 | 2.63 | |
| Democratic | Angelica Earl | 15,500 | 2.55 | |
| Democratic | Travis Gonzalez | 9,480 | 1.56 | |
| Democratic | Leonard Joseph Steinman II | 7,657 | 1.26 | |
| Total votes | 607,577 | 100.00 | ||
| Party | Candidate | Votes | % | |
|---|---|---|---|---|
| Republican | Josh Hawley | 389,978 | 58.64 | |
| Republican | Tony Monetti | 64,834 | 9.75 | |
| Republican | Austin Petersen | 54,916 | 8.26 | |
| Republican | Kristi Nichols | 49,640 | 7.47 | |
| Republican | Christina Smith | 35,024 | 5.27 | |
| Republican | Ken Patterson | 19,579 | 2.94 | |
| Republican | Peter Pfeifer | 16,594 | 2.50 | |
| Republican | Courtland Sykes | 13,870 | 2.09 | |
| Republican | Fred Ryman | 8,781 | 1.32 | |
| Republican | Brian G. Hagg | 6,871 | 1.03 | |
| Republican | Bradley Krembs | 4,902 | 0.74 | |
| Total votes | 664,889 | 100.00 | ||
| Party | Candidate | Votes | % | |
|---|---|---|---|---|
| Republican | Josh Hawley | 1,254,927 | 51.38 | |
| Democratic | Claire McCaskill (incumbent) | 1,112,935 | 45.57 | |
| Independent | Craig O'Dear | 34,398 | 1.41 | |
| Libertarian | Japheth Campbell | 27,316 | 1.12 | |
| Green | Jo Crain | 12,706 | 0.52 | |
| Write-in | 7 | 0.00 | ||
| Total votes | 2,442,289 | 100.00 | ||
| Republican gain from Democratic | ||||
Montana[]
| Turnout | 70.86% | ||||||||||||||||
|---|---|---|---|---|---|---|---|---|---|---|---|---|---|---|---|---|---|
| |||||||||||||||||
 County results | |||||||||||||||||
| |||||||||||||||||


Two-term Democrat Jon Tester was re-elected with 49% of the vote in 2012. He won the Democratic nomination in the June 5 primary with no opposition.[70]
State Auditor Matthew Rosendale[70] won the Republican nomination in the June 5 primary. State Senator Albert Olszewski,[70] former judge Russell Fagg,[70] and Troy Downing[70] also ran for the Republican nomination.
Tester was re-elected winning over 50% of the vote.[71]
| Party | Candidate | Votes | % | |
|---|---|---|---|---|
| Democratic | Jon Tester (incumbent) | 114,948 | 100.00 | |
| Write-in | 5 | 0.00 | ||
| Total votes | 114,953 | 100.00 | ||
| Party | Candidate | Votes | % | |
|---|---|---|---|---|
| Republican | Matt Rosendale | 51,859 | 33.82 | |
| Republican | Russell Fagg | 43,465 | 28.34 | |
| Republican | Troy Downing | 29,341 | 19.13 | |
| Republican | Albert Olszewski | 28,681 | 18.70 | |
| Write-in | 9 | 0.01 | ||
| Total votes | 153,355 | 100.00 | ||
| Party | Candidate | Votes | % | |
|---|---|---|---|---|
| Democratic | Jon Tester (incumbent) | 253,876 | 50.33 | |
| Republican | Matt Rosendale | 235,963 | 46.78 | |
| Libertarian | Rick Breckenridge | 14,545 | 2.88 | |
| Total votes | 504,384 | 100.00 | ||
| Democratic hold | ||||
Nebraska[]
| Turnout | 57.32% | ||||||||||||||||
|---|---|---|---|---|---|---|---|---|---|---|---|---|---|---|---|---|---|
| |||||||||||||||||
 County results | |||||||||||||||||
| |||||||||||||||||

One-term Republican Deb Fischer was elected with 58% of the vote in 2012. She ran for and won the Republican nomination in the May 15 primary.[72] Other Republicans who ran include retired professor Jack Heidel, Todd Watson, and Dennis Frank Macek.[73]
Lincoln Councilwoman Jane Raybould ran for and won the Democratic nomination in the May 15 primary.[72] Other Democrats who ran include Frank Svoboda, Chris Janicek, and Larry Marvin, who was a candidate in 2008, 2012, and 2014.[73]
Jim Schultz ran for the Libertarian nomination.[72]
Fischer was easily re-elected.[74]
| Party | Candidate | Votes | % | |
|---|---|---|---|---|
| Republican | Deb Fischer (incumbent) | 128,157 | 75.79 | |
| Republican | Todd F. Watson | 19,661 | 11.63 | |
| Republican | Jack Heidel | 9,413 | 5.57 | |
| Republican | Jeffrey Lynn Stein | 6,380 | 3.77 | |
| Republican | Dennis Frank Macek | 5,483 | 3.24 | |
| Total votes | 169,094 | 100.00 | ||
| Party | Candidate | Votes | % | |
|---|---|---|---|---|
| Democratic | Jane Raybould | 59,067 | 63.68 | |
| Democratic | Chris Janicek | 18,752 | 20.22 | |
| Democratic | Frank B. Svoboda | 10,548 | 11.37 | |
| Democratic | Larry Marvin | 4,393 | 4.74 | |
| Total votes | 92,760 | 100.00 | ||
| Party | Candidate | Votes | % | |
|---|---|---|---|---|
| Republican | Deb Fischer (incumbent) | 403,151 | 57.69 | |
| Democratic | Jane Raybould | 269,917 | 38.62 | |
| Libertarian | Jim Schultz | 25,349 | 3.63 | |
| Write-in | 466 | 0.07 | ||
| Total votes | 698,883 | 100.00 | ||
| Republican hold | ||||
Nevada[]
| Turnout | 62.26% | ||||||||||||||||
|---|---|---|---|---|---|---|---|---|---|---|---|---|---|---|---|---|---|
| |||||||||||||||||
 County results | |||||||||||||||||
| |||||||||||||||||


Incumbent Republican Dean Heller was the Republican nominee.[75] He was appointed to the seat in 2011 and then elected with 46% of the vote in 2012. Heller considered running for governor, but chose to seek re-election.[76]
Nevada was the only state in the midterm elections that had an incumbent Republican Senator in a state that Hillary Clinton had won in 2016.
Representative Jacky Rosen[76] is the Democratic nominee.[75]
Rosen defeated Heller in the general election, making Heller the only Republican incumbent to lose re-election in 2018.[77]
| Party | Candidate | Votes | % | |
|---|---|---|---|---|
| Republican | Dean Heller (incumbent) | 99,509 | 69.97 | |
| Republican | Tom Heck | 26,296 | 18.49 | |
| None of These Candidates | 5,978 | 4.20 | ||
| Republican | Sherry Brooks | 5,145 | 3.62 | |
| Republican | Sarah Gazala | 4,011 | 2.82 | |
| Republican | Vic Harrell | 1,282 | 0.90 | |
| Total votes | 142,221 | 100.00 | ||
| Party | Candidate | Votes | % | |
|---|---|---|---|---|
| Democratic | Jacky Rosen | 110,567 | 77.11 | |
| None of These Candidates | 10,078 | 7.03 | ||
| Democratic | David Drew Knight | 6,346 | 4.43 | |
| Democratic | Allen Rheinhart | 4,782 | 3.33 | |
| Democratic | Jesse Sbaih | 4,540 | 3.17 | |
| Democratic | Sujeet Mahendra | 3,835 | 2.67 | |
| Democratic | Danny Burleigh | 3,244 | 2.26 | |
| Total votes | 143,392 | 100.00 | ||
| Party | Candidate | Votes | % | |
|---|---|---|---|---|
| Democratic | Jacky Rosen | 490,071 | 50.41 | |
| Republican | Dean Heller (incumbent) | 441,202 | 45.38 | |
| None of These Candidates | 15,303 | 1.57 | ||
| Independent | Barry Michaels | 9,269 | 0.95 | |
| Libertarian | Tim Hagan | 9,196 | 0.95 | |
| Independent American | Kamau A. Bakari | 7,091 | 0.73 | |
| Total votes | 972,132 | 100.00 | ||
| Democratic gain from Republican | ||||
New Jersey[]
| Turnout | 53.38% | ||||||||||||||||
|---|---|---|---|---|---|---|---|---|---|---|---|---|---|---|---|---|---|
| |||||||||||||||||
 County results | |||||||||||||||||
| |||||||||||||||||

Republican Bob Hugin[78] was nominated to face two-term Democrat Bob Menendez, who was re-elected with 59% of the vote in 2012. Menendez was originally appointed to the seat in January 2006. He ran for re-election, despite recent scandals that plagued his campaign.[78]
Hugin self-funded most of his campaign. Ultimately, Menendez was re-elected with nearly 54% of the vote.[79]
| Party | Candidate | Votes | % | |
|---|---|---|---|---|
| Democratic | Bob Menendez (incumbent) | 262,477 | 62.28 | |
| Democratic | Lisa A. McCormick | 158,998 | 37.72 | |
| Total votes | 421,475 | 100.00 | ||
| Party | Candidate | Votes | % | |
|---|---|---|---|---|
| Republican | Bob Hugin | 168,052 | 75.13 | |
| Republican | Brian D. Goldberg | 55,624 | 24.87 | |
| Total votes | 223,676 | 100.00 | ||
| Party | Candidate | Votes | % | |
|---|---|---|---|---|
| Democratic | Bob Menendez (incumbent) | 1,711,654 | 54.01 | |
| Republican | Bob Hugin | 1,357,355 | 42.83 | |
| Green | Madelyn R. Hoffman | 25,150 | 0.79 | |
| Libertarian | Murray Sabrin | 21,212 | 0.67 | |
| Independent | Natalie Lynn Rivera | 19,897 | 0.63 | |
| Independent | Tricia Flanagan | 16,101 | 0.51 | |
| Independent | Kevin Kimple | 9,087 | 0.29 | |
| Independent | Hank Schroeder | 8,854 | 0.28 | |
| Total votes | 3,169,310 | 100.00 | ||
| Democratic hold | ||||
New Mexico[]
| Turnout | 55.03% | ||||||||||||||||||||
|---|---|---|---|---|---|---|---|---|---|---|---|---|---|---|---|---|---|---|---|---|---|
| |||||||||||||||||||||
 County results | |||||||||||||||||||||
| |||||||||||||||||||||


One-term Democrat Martin Heinrich was elected with 51% of the vote in 2012. He ran.[80] Mick Rich won the Republican nomination unopposed.[80]
Aubrey Dunn Jr., New Mexico Commissioner of Public Lands and otherwise the first Libertarian to ever hold statewide elected office in history, announced his run for the seat,[80] but stepped aside in August to allow former Governor of New Mexico, Gary Johnson's candidacy.
Heinrich was easily re-elected, defeating Rich and Johnson.
| Party | Candidate | Votes | % | |
|---|---|---|---|---|
| Democratic | Martin Heinrich (incumbent) | 152,145 | 100.00 | |
| Total votes | 152,145 | 100.00 | ||
| Party | Candidate | Votes | % | |
|---|---|---|---|---|
| Republican | Mick Rich | 67,502 | 100.00 | |
| Total votes | 67,502 | 100.00 | ||
| Party | Candidate | Votes | % | |
|---|---|---|---|---|
| Libertarian | Aubrey Dunn Jr. | 623 | 100.00 | |
| Total votes | 623 | 100.00 | ||
| Party | Candidate | Votes | % | |
|---|---|---|---|---|
| Democratic | Martin Heinrich (incumbent) | 376,998 | 54.09 | |
| Republican | Mick Rich | 212,813 | 30.53 | |
| Libertarian | Gary Johnson | 107,201 | 15.38 | |
| Total votes | 697,012 | 100.00 | ||
| Democratic hold | ||||
New York[]
| Turnout | 52.32% | ||||||||||||||||
|---|---|---|---|---|---|---|---|---|---|---|---|---|---|---|---|---|---|
| |||||||||||||||||
 County results | |||||||||||||||||
| |||||||||||||||||
One-term Democrat Kirsten Gillibrand was elected with 72% of the vote in 2012. She had previously been appointed to the seat in 2009 and won a special election to remain in office in 2010. She ran.[81]
Private equity executive Chele Chiavacci Farley has been nominated for U.S. Senate by the Republican and Conservative Parties.[81]
Gillibrand was elected to a second term.[82]
| Party | Candidate | Votes | % | |
|---|---|---|---|---|
| Democratic | Kirsten Gillibrand | 3,755,489 | 61.98 | |
| Working Families | Kirsten Gillibrand | 160,128 | 2.64 | |
| Independence | Kirsten Gillibrand | 99,325 | 1.64 | |
| Women's Equality | Kirsten Gillibrand | 41,989 | 0.69 | |
| Total | Kirsten Gillibrand (incumbent) | 4,056,931 | 66.96 | |
| Republican | Chele Chiavacci Farley | 1,730,439 | 28.56 | |
| Conservative | Chele Chiavacci Farley | 246,171 | 4.06 | |
| Reform | Chele Chiavacci Farley | 21,610 | 0.36 | |
| Total | Chele Chiavacci Farley | 1,998,220 | 32.98 | |
| Write-in | 3,872 | 0.06 | ||
| Total votes | 6,059,023 | 100.00 | ||
| Democratic hold | ||||
North Dakota[]
| Turnout | 56.27% | ||||||||||||||||
|---|---|---|---|---|---|---|---|---|---|---|---|---|---|---|---|---|---|
| |||||||||||||||||
 County results | |||||||||||||||||
| |||||||||||||||||


One-term Democrat Heidi Heitkamp was elected with 50% of the vote in 2012. She won the Democratic nomination unopposed.[83]
Representative Kevin Cramer[83] won the Republican nomination in the June 12 primary. Former Niagara, North Dakota Mayor Thomas O'Neill[83] also ran for the Republican nomination.
Heitkamp was continuously behind in the polls leading up to the election, and Heitkamp ended up losing to Cramer by 11%.[84]
| Party | Candidate | Votes | % | |
|---|---|---|---|---|
| Democratic-NPL | Heidi Heitkamp (incumbent) | 36,729 | 99.58 | |
| Write-in | 154 | 0.42 | ||
| Total votes | 36,883 | 100.00 | ||
| Party | Candidate | Votes | % | |
|---|---|---|---|---|
| Republican | Kevin Cramer | 61,529 | 87.73 | |
| Republican | Thomas O'Neill | 8,509 | 12.13 | |
| Write-in | 95 | 0.14 | ||
| Total votes | 70,133 | 100.00 | ||
| Party | Candidate | Votes | % | |
|---|---|---|---|---|
| Republican | Kevin Cramer | 179,720 | 55.11 | |
| Democratic-NPL | Heidi Heitkamp (incumbent) | 144,376 | 44.27 | |
| Write-in | 2,042 | 0.63 | ||
| Total votes | 326,138 | 100.00 | ||
| Republican gain from Democratic-NPL | ||||
Ohio[]
| Turnout | 54.65% | ||||||||||||||||
|---|---|---|---|---|---|---|---|---|---|---|---|---|---|---|---|---|---|
| |||||||||||||||||
 County results | |||||||||||||||||
| |||||||||||||||||


Two-term Democrat Sherrod Brown was re-elected with 51% of the vote in 2012. He ran and was unopposed in Democratic primary.[85]
U.S. Representative Jim Renacci ran for and won the Republican nomination in the May 8 primary.[85] Other Republicans who ran include investment banker Michael Gibbons,[85] businesswoman Melissa Ackison,[85] Dan Kiley,[85] and Don Elijah Eckhart.[85]
Brown won re-election, defeating Renacci. Brown was the only non-judicial statewide Democrat in Ohio to win in 2018.[86]
| Party | Candidate | Votes | % | |
|---|---|---|---|---|
| Democratic | Sherrod Brown (incumbent) | 613,373 | 100.00 | |
| Total votes | 613,373 | 100.00 | ||
| Party | Candidate | Votes | % | |
|---|---|---|---|---|
| Republican | Jim Renacci | 363,622 | 47.34 | |
| Republican | Mike Gibbons | 243,426 | 31.69 | |
| Republican | Melissa Ackison | 100,543 | 13.09 | |
| Republican | Dan Kiley | 30,684 | 3.99 | |
| Republican | Don Elijah Eckhart | 29,796 | 3.88 | |
| Write-in | 78 | 0.01 | ||
| Total votes | 768,149 | 100.00 | ||
| Party | Candidate | Votes | % | |
|---|---|---|---|---|
| Democratic | Sherrod Brown (incumbent) | 2,358,508 | 53.40 | |
| Republican | Jim Renacci | 2,057,559 | 46.58 | |
| Write-in | 1,017 | 0.02 | ||
| Total votes | 4,417,084 | 100.00 | ||
| Democratic hold | ||||
Pennsylvania[]
| Turnout | 58.18% | ||||||||||||||||
|---|---|---|---|---|---|---|---|---|---|---|---|---|---|---|---|---|---|
| |||||||||||||||||
 County results | |||||||||||||||||
| |||||||||||||||||

Two-term Democrat Bob Casey Jr. was re-elected with 54% of the vote in 2012. He ran and won the Democratic primary unopposed.[87]
U.S. Representative Lou Barletta ran for and won the Republican nomination in the May 15 primary.[87] Jim Christiana also ran for the Republican nomination.[87]
Casey was easily re-elected.[88]
| Party | Candidate | Votes | % | |
|---|---|---|---|---|
| Democratic | Bob Casey Jr. (incumbent) | 752,008 | 99.13 | |
| Write-in | 6,584 | 0.87 | ||
| Total votes | 758,592 | 100.00 | ||
| Party | Candidate | Votes | % | |
|---|---|---|---|---|
| Republican | Lou Barletta | 433,312 | 62.80 | |
| Republican | Jim Christiana | 254,118 | 36.83 | |
| Write-in | 2,553 | 0.37 | ||
| Total votes | 689,983 | 100.00 | ||
| Party | Candidate | Votes | % | |
|---|---|---|---|---|
| Democratic | Bob Casey Jr. (incumbent) | 2,792,437 | 55.73 | |
| Republican | Lou Barletta | 2,134,848 | 42.60 | |
| Libertarian | Dale Kerns | 50,907 | 1.02 | |
| Green | Neal Gale | 31,208 | 0.62 | |
| Write-in | 1,568 | 0.03 | ||
| Total votes | 5,010,968 | 100.00 | ||
| Democratic hold | ||||
Rhode Island[]
| Turnout | 47.69% | ||||||||||||||||
|---|---|---|---|---|---|---|---|---|---|---|---|---|---|---|---|---|---|
| |||||||||||||||||
 Municipal results | |||||||||||||||||
| |||||||||||||||||

Two-term Democrat Sheldon Whitehouse was re-elected with 64% of the vote in 2012. He ran.[89]
Former Rhode Island Supreme Court Associate Justice Robert Flanders[89] was the Republican nominee.
Whitehouse was elected to a third term by a wide margin.
| Party | Candidate | Votes | % | |
|---|---|---|---|---|
| Democratic | Sheldon Whitehouse (incumbent) | 89,140 | 76.79 | |
| Democratic | Patricia Fontes | 26,947 | 23.21 | |
| Total votes | 116,087 | 100.00 | ||
| Party | Candidate | Votes | % | |
|---|---|---|---|---|
| Republican | Robert Flanders | 26,543 | 87.70 | |
| Republican | Rocky De La Fuente | 3,722 | 12.30 | |
| Total votes | 30,265 | 100.00 | ||
| Party | Candidate | Votes | % | |
|---|---|---|---|---|
| Democratic | Sheldon Whitehouse (incumbent) | 231,477 | 61.44 | |
| Republican | Robert Flanders | 144,421 | 38.33 | |
| Write-in | 840 | 0.22 | ||
| Total votes | 376,738 | 100.00 | ||
| Democratic hold | ||||
Tennessee[]
| Turnout | 53.89% | ||||||||||||||||
|---|---|---|---|---|---|---|---|---|---|---|---|---|---|---|---|---|---|
| |||||||||||||||||
 County results | |||||||||||||||||
| |||||||||||||||||


Two-term Republican Bob Corker was re-elected with 65% of the vote in 2012. Senator Corker filed his Statement of Candidacy with the Secretary of the U.S. Senate to run for re-election,[90] but on September 26, 2017, Senator Corker announced his intent to retire.[91]
Aaron Pettigrew[92] and Republican U.S. Representative Marsha Blackburn[92] ran for the Republican nomination. Marsha Blackburn became the Republican nominee.
Former Tennessee Governor Phil Bredesen[92] became the Democratic nominee.
Despite predictions that the race would be close, Blackburn was easily elected to the Senate.[93]
| Party | Candidate | Votes | % | |
|---|---|---|---|---|
| Republican | Marsha Blackburn | 613,513 | 84.48 | |
| Republican | Aaron Pettigrew | 112,705 | 15.52 | |
| Write-in | 13 | 0.00 | ||
| Total votes | 726,231 | 100.00 | ||
| Party | Candidate | Votes | % | |
|---|---|---|---|---|
| Democratic | Phil Bredesen | 349,718 | 91.51 | |
| Democratic | Gary Davis | 20,170 | 5.28 | |
| Democratic | John Wolfe Jr. | 12,269 | 3.21 | |
| Total votes | 382,157 | 100.00 | ||
| Party | Candidate | Votes | % | |
|---|---|---|---|---|
| Republican | Marsha Blackburn | 1,227,483 | 54.71 | |
| Democratic | Phil Bredesen | 985,450 | 43.92 | |
| Independent | Trudy Austin | 9,455 | 0.42 | |
| Independent | Dean Hill | 8,717 | 0.39 | |
| Independent | Kris Todd | 5,084 | 0.23 | |
| Independent | John Carico | 3,398 | 0.15 | |
| Independent | Breton Phillips | 2,226 | 0.10 | |
| Independent | Kevin Lee McCants | 1,927 | 0.09 | |
| Total votes | 2,243,740 | 100.00 | ||
| Republican hold | ||||
Texas[]
| Turnout | 53.01% | ||||||||||||||||
|---|---|---|---|---|---|---|---|---|---|---|---|---|---|---|---|---|---|
| |||||||||||||||||
 County results | |||||||||||||||||
| |||||||||||||||||


One-term Republican Ted Cruz was elected with 57% of the vote in 2012. He overwhelmingly won the Republican primary on March 6, 2018.[94] Television producer Bruce Jacobson,[95] Houston energy attorney Stefano de Stefano,[96] former mayor of La Marque Geraldine Sam,[97] Mary Miller,[98] and Thomas Dillingham[99] were Cruz's opponents.
U.S. Representative Beto O'Rourke won the Democratic nomination on March 6, 2018.[94] Other Democrats who ran include Irasema Ramirez Hernandez[100] and Edward Kimbrough.[101]
Nurse Carl Bible ran as an independent.[102] Bob McNeil ran as the candidate of the American Citizen Party.[103] Neal Dikeman was the Libertarian nominee.[104]
O'Rourke ran a strong campaign, creating a close race in a traditionally Republican stronghold.[105] Nevertheless, Cruz was narrowly re-elected to a second term.[106]
| Party | Candidate | Votes | % | |
|---|---|---|---|---|
| Republican | Ted Cruz (incumbent) | 1,322,724 | 85.36 | |
| Republican | Mary Miller | 94,715 | 6.11 | |
| Republican | Bruce Jacobson Jr. | 64,791 | 4.18 | |
| Republican | Stefano de Stefano | 44,456 | 2.87 | |
| Republican | Geraldine Sam | 22,887 | 1.48 | |
| Total votes | 1,549,573 | 100.00 | ||
| Party | Candidate | Votes | % | |
|---|---|---|---|---|
| Democratic | Beto O'Rourke | 644,632 | 61.81 | |
| Democratic | Sema Hernandez | 247,424 | 23.72 | |
| Democratic | Edward Kimbrough | 150,858 | 14.47 | |
| Total votes | 1,042,914 | 100.00 | ||
| Party | Candidate | Votes | % | |
|---|---|---|---|---|
| Republican | Ted Cruz (incumbent) | 4,260,553 | 50.89 | |
| Democratic | Beto O'Rourke | 4,045,632 | 48.33 | |
| Libertarian | Neal Dikeman | 65,470 | 0.78 | |
| Total votes | 8,371,655 | 100.00 | ||
| Republican hold | ||||
Utah[]
| Turnout | 74.15% | ||||||||||||||||
|---|---|---|---|---|---|---|---|---|---|---|---|---|---|---|---|---|---|
| |||||||||||||||||
 County results | |||||||||||||||||
| |||||||||||||||||

Seven-term Republican Orrin Hatch was re-elected with 65% of the vote in 2012. Hatch is the President pro tempore of the United States Senate, as well as the second most-senior Senator. Before the 2012 election, Hatch said that he would retire at the end of his seventh term if he was re-elected.[107] Hatch initially announced his re-election campaign on March 9, 2017,[108][109] but later announced his plans to retire on January 2, 2018. Former 2012 Republican presidential nominee Mitt Romney was running for the seat.[110]
Professor James Singer was running for the Democratic nomination, but he dropped out and endorsed Salt Lake County Councilwoman Jenny Wilson, who made her Senate bid official on July 17, 2017.[111][112] Danny Drew[113][114] also was running, but dropped out and endorsed Jenny Wilson. Mitchell Kent Vice was defeated for the Democratic nomination by Wilson.
Mitt Romney was easily elected, defeating Wilson.[115]
| Party | Candidate | Votes | % | |
|---|---|---|---|---|
| Republican | Mitt Romney | 240,021 | 71.27 | |
| Republican | Mike Kennedy | 96,771 | 28.73 | |
| Total votes | 336,792 | 100.00 | ||
| Party | Candidate | Votes | % | |
|---|---|---|---|---|
| Republican | Mitt Romney | 665,215 | 62.59 | |
| Democratic | Jenny Wilson | 328,541 | 30.91 | |
| Constitution | Tim Aalders | 28,774 | 2.71 | |
| Libertarian | Craig Bowden | 27,607 | 2.60 | |
| Reed McCandless | 12,708 | 1.20 | ||
| Write-in | 52 | 0.00 | ||
| Total votes | 1,062,897 | 100.00 | ||
| Republican hold | ||||
Vermont[]
| Turnout | 55.57% | ||||||||||||||||
|---|---|---|---|---|---|---|---|---|---|---|---|---|---|---|---|---|---|
| |||||||||||||||||
 County results | |||||||||||||||||
| |||||||||||||||||

Two-term Independent Senator Bernie Sanders was re-elected with 71% of the vote in 2012. Sanders, one of two independent members of Congress, has caucused with the Democratic Party since taking office in 2007. In November 2015, Sanders announced his plans to run as a Democrat, rather than an Independent, in all future elections. He won the nomination easily.[116]
Sanders easily won election to a third term.[117]
| Party | Candidate | Votes | % | |
|---|---|---|---|---|
| Democratic | Bernie Sanders (incumbent) | 63,683 | 94.02 | |
| Democratic | Folsade Adeluola | 3,766 | 5.56 | |
| Write-in | 281 | 0.41 | ||
| Total votes | 67,730 | 100.00 | ||
| Party | Candidate | Votes | % | |
|---|---|---|---|---|
| Republican | H. Brooke Paige | 9,805 | 37.37 | |
| Republican | Lawrence Zupan | 9,383 | 35.86 | |
| Republican | Jasdeep Pannu | 4,527 | 17.30 | |
| Write-in | Bernie Sanders (incumbent) | 1,081 | 4.13 | |
| Republican | Rocky De La Fuente | 1,057 | 4.04 | |
| Write-in | 314 | 1.20 | ||
| Total votes | 26,167 | 100.00 | ||
| Party | Candidate | Votes | % | |
|---|---|---|---|---|
| Independent | Bernie Sanders (incumbent) | 183,649 | 67.36 | |
| Republican | Lawrence Zupan | 74,815 | 27.44 | |
| Independent | Brad Peacock | 3,665 | 1.34 | |
| Independent | Russell Beste | 2,763 | 1.01 | |
| Independent | Edward Gilbert Jr. | 2,244 | 0.82 | |
| Independent | Folasade Adeluola | 1,979 | 0.73 | |
| Liberty Union | Reid Kane | 1,171 | 0.43 | |
| Independent | Jon Svitavsky | 1,130 | 0.41 | |
| Independent | Bruce Busa | 914 | 0.34 | |
| Write-in | 294 | 0.11 | ||
| Total votes | 272,624 | 100.00 | ||
| Independent hold | ||||
Virginia[]
| Turnout | 59.14% | ||||||||||||||||
|---|---|---|---|---|---|---|---|---|---|---|---|---|---|---|---|---|---|
| |||||||||||||||||
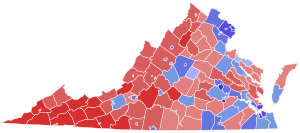 County results | |||||||||||||||||
| |||||||||||||||||


One-term Democrat Tim Kaine was elected with 53% of the vote in 2012. He was re-nominated unopposed.[118] Prince William County Supervisor Corey Stewart[118] was the Republican nominee. was the Libertarian nominee.[119] Kaine defeated Stewart with 57% of the vote. Stewart received about 41% of the vote.[120]
| Party | Candidate | Votes | % | |
|---|---|---|---|---|
| Republican | Corey Stewart | 136,610 | 44.86 | |
| Republican | Nick Freitas | 131,321 | 43.12 | |
| Republican | E. W. Jackson | 36,508 | 11.99 | |
| Write-in | 79 | 0.03 | ||
| Total votes | 304,518 | 100.00 | ||
| Party | Candidate | Votes | % | |
|---|---|---|---|---|
| Democratic | Tim Kaine (incumbent) | 1,910,370 | 57.00 | |
| Republican | Corey Stewart | 1,374,313 | 41.00 | |
| Libertarian | Matt Waters | 61,565 | 1.84 | |
| Write-in | 5,509 | 0.16 | ||
| Total votes | 3,351,757 | 100.00 | ||
| Democratic hold | ||||
Washington[]
| Turnout | 70.74% | ||||||||||||||||
|---|---|---|---|---|---|---|---|---|---|---|---|---|---|---|---|---|---|
| |||||||||||||||||
 County results | |||||||||||||||||
| |||||||||||||||||


Three-term Democrat Maria Cantwell was re-elected with 61% of the vote in 2012. She ran.[121]
Washington holds non-partisan blanket primaries, in which the top two finishers advance to the general election regardless of party. Cantwell and former state Republican Party chair Susan Hutchison faced each other in November.
Cantwell won re-election by a large margin.[122]
| Party | Candidate | Votes | % | |
|---|---|---|---|---|
| Democratic | Maria Cantwell (incumbent) | 929,961 | 54.68 | |
| Republican | Susan Hutchison | 413,317 | 24.30 | |
| Republican | Keith Swank | 39,818 | 2.34 | |
| Republican | Joey Gibson | 38,676 | 2.27 | |
| Democratic | Clint Tannehill | 35,770 | 2.10 | |
| Republican | Dave Bryant | 33,962 | 2.00 | |
| Republican | Art Coday | 30,654 | 1.80 | |
| Independent | Jennifer Ferguson | 25,224 | 1.48 | |
| Republican | Tim Owen | 23,167 | 1.36 | |
| Republican | Matt Hawkins | 13,324 | 0.78 | |
| Democratic | Don Rivers | 12,634 | 0.74 | |
| Libertarian | Mike Luke | 12,302 | 0.72 | |
| Republican | Glen Stockwell | 11,611 | 0.68 | |
| Independent | Thor Amundson | 9,393 | 0.55 | |
| Democratic | Mohammad Said | 8,649 | 0.51 | |
| Republican | Matthew Heines | 7,737 | 0.45 | |
| Freedom Socialist | Steve Hoffman | 7,390 | 0.43 | |
| Republican | Goodspaceguy | 7,057 | 0.41 | |
| Republican | John Orlinski | 6,905 | 0.41 | |
| Independent | Dave Strider | 6,821 | 0.40 | |
| Republican | Rocky De La Fuente | 5,724 | 0.34 | |
| Green | James Robert Deal | 3,849 | 0.23 | |
| Independent | Sam Wright | 3,761 | 0.22 | |
| Independent | Brad Chase | 2,655 | 0.16 | |
| Democratic | George Kalberer | 2,448 | 0.14 | |
| Independent | Charlie Jackson | 2,411 | 0.14 | |
| Republican | RC Smith | 2,238 | 0.13 | |
| Independent | Jon Butler | 2,016 | 0.12 | |
| Independent | Alex Tsimerman | 1,366 | 0.08 | |
| Total votes | 1,700,840 | 100.00 | ||
| Party | Candidate | Votes | % | |
|---|---|---|---|---|
| Democratic | Maria Cantwell (incumbent) | 1,803,364 | 58.43 | |
| Republican | Susan Hutchison | 1,282,804 | 41.57 | |
| Total votes | 3,086,168 | 100.00 | ||
| Democratic hold | ||||
West Virginia[]
| Turnout | 47.04% | ||||||||||||||||
|---|---|---|---|---|---|---|---|---|---|---|---|---|---|---|---|---|---|
| |||||||||||||||||
 County results | |||||||||||||||||
| |||||||||||||||||


One-term Democrat Joe Manchin was elected with 61% of the vote in 2012. He originally won the seat in a 2010 special election. Manchin ran for re-election and won the May 8 Democratic primary.[123] Environmental activist Paula Jean Swearengin,[123] also ran for the Democratic nomination.
West Virginia Attorney General Patrick Morrisey received the Republican nomination in the May 8 primary. Representative Evan Jenkins,[123] coal miner Bo Copley,[123] Jack Newbrough, Don Blankenship, and Tom Willis ran for the Republican nomination.[123]
Despite recent Republican successes in West Virginia, Manchin was able to win re-election to a second term.[124]
| Party | Candidate | Votes | % | |
|---|---|---|---|---|
| Democratic | Joe Manchin (incumbent) | 112,658 | 69.86 | |
| Democratic | Paula Jean Swearengin | 48,594 | 30.14 | |
| Total votes | 161,252 | 100.00 | ||
| Party | Candidate | Votes | % | |
|---|---|---|---|---|
| Republican | Patrick Morrisey | 48,007 | 34.90 | |
| Republican | Evan Jenkins | 40,185 | 29.21 | |
| Republican | Don Blankenship | 27,478 | 19.97 | |
| Republican | Tom Willis | 13,540 | 9.84 | |
| Republican | Bo Copley | 4,248 | 3.09 | |
| Republican | Jack Newbrough | 4,115 | 2.99 | |
| Total votes | 137,573 | 100.00 | ||
| Party | Candidate | Votes | % | |
|---|---|---|---|---|
| Democratic | Joe Manchin (incumbent) | 290,510 | 49.57 | |
| Republican | Patrick Morrisey | 271,113 | 46.26 | |
| Libertarian | Rusty Hollen | 24,411 | 4.17 | |
| Total votes | 586,034 | 100.00 | ||
| Democratic hold | ||||
Wisconsin[]
| Turnout | 81.81% | ||||||||||||||||
|---|---|---|---|---|---|---|---|---|---|---|---|---|---|---|---|---|---|
| |||||||||||||||||
 County results | |||||||||||||||||
| |||||||||||||||||


One-term Democrat Tammy Baldwin was elected with 51% of the vote in 2012. She ran.[125]
State Senator Leah Vukmir[125] and businessman and member of Wisconsin Board of Veterans Affairs Kevin Nicholson[125] ran for the Republican nomination, with Vukmir proceeding to the general election.
Baldwin was re-elected with over 55% of the vote.[126]
| Party | Candidate | Votes | % | |
|---|---|---|---|---|
| Democratic | Tammy Baldwin (incumbent) | 510,812 | 99.64 | |
| Write-in | 1,848 | 0.36 | ||
| Total votes | 512,660 | 100.00 | ||
| Party | Candidate | Votes | % | |
|---|---|---|---|---|
| Republican | Leah Vukmir | 217,230 | 48.90 | |
| Republican | Kevin Nicholson | 191,276 | 43.06 | |
| Republican | George Lucia | 18,786 | 4.23 | |
| Republican | Griffin Jones | 8,699 | 1.96 | |
| Republican | Charles Barman | 7,959 | 1.79 | |
| Write-in | 303 | 0.07 | ||
| Total votes | 444,253 | 100.00 | ||
| Party | Candidate | Votes | % | |
|---|---|---|---|---|
| Democratic | Tammy Baldwin (incumbent) | 1,472,914 | 55.36 | |
| Republican | Leah Vukmir | 1,184,885 | 44.53 | |
| Write-in | 2,964 | 0.11 | ||
| Total votes | 2,660,763 | 100.00 | ||
| Democratic hold | ||||
Wyoming[]
| Turnout | 77.43% | ||||||||||||||||
|---|---|---|---|---|---|---|---|---|---|---|---|---|---|---|---|---|---|
| |||||||||||||||||
 County results | |||||||||||||||||
| |||||||||||||||||


One-term Republican John Barrasso was elected with 76% of the vote in 2012. Barrasso was appointed to the seat in 2007 and won a special election in 2008. He ran.[127]
Gary Trauner,[127] a Jackson Hole businessman and U.S. House candidate in 2006 and 2008, was the Democratic nominee.
Barrasso was easily elected to a second term, defeating Trauner.[128]
| Party | Candidate | Votes | % | |
|---|---|---|---|---|
| Republican | John Barrasso (incumbent) | 74,292 | 64.76 | |
| Republican | Dave Dodson | 32,647 | 28.46 | |
| Republican | John Holtz | 2,981 | 2.60 | |
| Republican | Charlie Hardy | 2,377 | 2.07 | |
| Republican | Rocky De La Fuente | 1,280 | 1.12 | |
| Republican | Anthony Van Risseghem | 870 | 0.76 | |
| Write-in | 267 | 0.23 | ||
| Total votes | 114,714 | 100.00 | ||
| Party | Candidate | Votes | % | |
|---|---|---|---|---|
| Democratic | Gary Trauner | 17,562 | 98.90 | |
| Write-in | 195 | 1.10 | ||
| Total votes | 17,757 | 100.00 | ||
| Party | Candidate | Votes | % | |
|---|---|---|---|---|
| Republican | John Barrasso (incumbent) | 136,210 | 66.96 | |
| Democratic | Gary Trauner | 61,227 | 30.10 | |
| Libertarian | Joseph Porambo | 5,658 | 2.78 | |
| Write-in | 325 | 0.16 | ||
| Total votes | 203,420 | 100.00 | ||
| Republican hold | ||||
See also[]
- 115th United States Congress
- 116th United States Congress
- 2018 United States House of Representatives elections
- 2018 United States gubernatorial elections
Notes[]
- ^ Total of official results for Democratic candidates.
- ^ Both general election candidates in California were members of the Democratic Party, having won the top two positions in the nonpartisan blanket primary (established by the 2010 California Proposition 14), so all 11.1 million votes in California were counted for Democrats, as tabulated by the Clerk of the House.[1][2] In 2012, the last time a Republican candidate for the U.S. Senate appeared on the ballot in California, 12.6 million votes were cast, of which 4.7 million, or 38%, were cast for the Republican candidate.
- ^ Total of official results for candidates labeled "Independent".
- ^ Jump up to: a b Appointee elected
- ^ The last elections for this group of senators were in 2012, except for those who were appointed after the resignation or passing of a sitting senator, as noted.
- ^ The Fox News Midterm Power Rankings uniquely does not contain a category for Safe/Solid races
- ^ Reflects the classic version of the forecast model.
- ^ Democrat Al Franken won with 53.2% of the vote in 2014, but resigned on January 2, 2018.
- ^ Special elections in Mississippi are nonpartisan, therefore party affiliation is not listed on the ballot.
- ^ Republican Thad Cochran won with 59.9% of the vote in 2014, but resigned on April 1, 2018 due to declining health.
- ^ Democratic total includes 2 Independents who caucus with the Democrats
- ^ Mississippi held a run-off for the special election on November 27, 2018 because no candidate won a majority of the vote in the November 6, 2018 jungle primary.
- ^ Indiana was the "tipping point" state.
- ^ Under California's "jungle primary" system, the general election was between two Democrats.
References[]
- ^ Jump up to: a b Clerk of the U.S. House of Representatives (February 28, 2019). "Statistics of the Congressional Election of November 6, 2018" (PDF). U.S. Government Printing Office. p. 57.
- ^ Blake, Aaron (November 7, 2018). "Some Democrats are complaining about the 'Senate popular vote.' It's still not a thing". The Washington Post. Retrieved November 7, 2018.
- ^ Kane, Paul (October 13, 2018). "Stark political divide points to a split decision in midterm elections". The Washington Post. Retrieved June 1, 2020.
- ^ Jump up to: a b Dick, Jason (January 20, 2016). "Senate Democrats, 2018 Math Is Not Your Friend". Roll Call. Retrieved August 2, 2016.
- ^ Livingston, Abby (January 6, 2017). "Rep. Beto O'Rourke "very likely" to run for Sen. Ted Cruz's seat in 2018". The Texas Tribune. Retrieved January 19, 2017.
- ^ Pramuk, Jacob (September 26, 2017). "Republican Sen. Bob Corker of Tennessee will not seek re-election, long-shot opportunity for Democrats". CNBC. Retrieved September 26, 2017.
- ^ Kondik, Kyle (July 25, 2013). "Senate 2014 and Beyond". Sabato's Crystal Ball. Retrieved September 19, 2013.
- ^ Fram, Alan (November 11, 2016). "Several Democrats facing 2018 re-election are from states Trump carried". PBS NewsHour. Retrieved November 12, 2016.
- ^ "Democrats face 'almost impossible map' to retake U.S. Senate". Reuters. August 24, 2018. Retrieved December 22, 2018.
- ^ Siddiqui, Sabrina (November 8, 2018). "Democrats got millions more votes – so how did Republicans win the Senate?". The Guardian. ISSN 0261-3077. Retrieved December 22, 2018.
- ^ Conradis, Brandon (November 7, 2018). "Schumer: 2020 'doesn't bode well' for GOP". TheHill. Retrieved December 22, 2018.
- ^ Wasserman, David (August 7, 2017). "The Congressional Map Has A Record-Setting Bias Against Democrats". FiveThirtyEight. Retrieved September 13, 2018.
- ^ "Republicans Are Favorites In The Senate, But Democrats Have Two Paths To An Upset". FiveThirtyEight. September 12, 2018. Retrieved September 13, 2018.
- ^ Matthew Yglesias (November 7, 2018). "4 winners and 2 losers from the 2018 midterm elections". Vox. Retrieved November 8, 2018.
- ^ "2016 State PVI Changes – Decision Desk HQ". decisiondeskhq.com. December 15, 2017. Archived from the original on June 13, 2018. Retrieved August 30, 2017.
- ^ "2018 Senate Race Ratings". Cook Political Report. October 26, 2018.
- ^ "Senate Ratings". Inside Elections. October 26, 2018.
- ^ "2017-2018 Crystal Ball Senate race ratings map". University of Virginia Center for Politics. November 5, 2018.
- ^ "2018 Election Calendar and Results". The New York Times. Retrieved January 24, 2018.
- ^ "2018 Senate Power Rankings". Fox News. Retrieved July 10, 2018.
- ^ "CNN Key Race Alert: This is the narrow path to a Democratic Senate". CNN. Retrieved September 9, 2018.
- ^ "Battle for the Senate 2018". RCP. Retrieved March 28, 2018.
- ^ "Daily Kos Elections 2018 race ratings". Daily Kos. October 5, 2018.
- ^ "Who wins 2018? Predictions for Every House & Senate Election". POLITICO. Retrieved September 8, 2018.
- ^ Silver, Nate (September 12, 2018). "Forecasting the race for the Senate". FiveThirtyEight. Retrieved October 25, 2018.
- ^ "Daily Kos Elections 2018 Primary Calendar". Daily Kos Elections. Retrieved January 30, 2018.
- ^ Jump up to: a b "2018 Primary and Runoff Elections for Statewide offices and Congress Chronologically with Filing Deadlines". The Green Papers. Retrieved November 14, 2017.
- ^ "2018 Poll Closing Times for Statewide office and Congress General Election Chronologically". The Green Papers. Retrieved November 14, 2017.
- ^ Jump up to: a b c d e f g "2018 Mississippi Candidate Qualifying List" (PDF). Mississippi Secretary of State. Retrieved March 24, 2018.
- ^ Jeff Flake (October 24, 2017). "Flake Announces Senate Future". United States senator Jeff Flake. Archived from the original on October 25, 2017. Retrieved December 20, 2017.
- ^ Jump up to: a b "2018 General Election". Arizona Secretary of State. Retrieved September 26, 2018.
- ^ Jump up to: a b c d e f g h i j k l m n o p q r s t u v w x y z aa ab ac ad ae af ag ah ai Federal Elections 2018 (PDF), Federal Election Commission, October 2019
- ^ Jump up to: a b "Certified List of Candidates (Regular)" (PDF). California Secretary of State. Retrieved September 27, 2018.
- ^ "Certified List of Candidates (Primaries)" (PDF). California Secretary of State. Retrieved February 5, 2019.
- ^ Bass, Paul (December 23, 2016). "Murphy Navigates A Changed World". New Haven Independent. Retrieved December 29, 2016.
- ^ Altimari, Danielle (August 22, 2017). "Corey Planning U.S. Senate Run Against Murphy". Hartford Courant. Retrieved August 22, 2017.
- ^ "Connecticut U.S. Senate Election Results". Retrieved December 2, 2018.
- ^ Jump up to: a b "GENERAL ELECTION June 11, 2018 FILED CANDIDATES BY OFFICE". Florida Department of State. Retrieved September 27, 2018.
- ^ "Delaware U.S. Senate Election Results". Retrieved December 2, 2018.
- ^ Jump up to: a b c "Candidate Listing for 2018 General Election". Florida Department of State. Retrieved April 10, 2018.
- ^ "Heated Florida Senate race goes to a recount". Press Herald. November 7, 2018. Retrieved December 2, 2018.
- ^ "Republican Rick Scott Wins Florida Senate Seat Over Incumbent Bill Nelson". NPR.org. Retrieved December 2, 2018.
- ^ Chakraborty, Barnini (November 18, 2018). "Bill Nelson concedes Florida Senate race to Rick Scott after manual recount". Fox News.
- ^ "Florida's Election Results Certified After Tumultuous Recounts". Talking Points Memo. Retrieved December 2, 2018.
- ^ "Candidates Filing Report". Hawaii Office of Election. Retrieved June 3, 2018.
- ^ Jump up to: a b c "Indiana Secretary of State Official Candidates" (PDF). Indiana Secretary of State. February 10, 2018. Retrieved February 10, 2018.
- ^ Jump up to: a b "Candidate List - 2018 Primary Election" (PDF). Indiana Secretary of State. February 12, 2018. Retrieved February 12, 2018.
- ^ "Indiana Election Results 2018: Live Midterm Map by County & Analysis". Retrieved December 2, 2018.
- ^ Blake, Aaron (November 5, 2014). "Angus King and Joe Manchin are sticking with the Democrats. Because, of course". The Washington Post. Retrieved May 28, 2015.
- ^ Jump up to: a b c "Maine Candidates Lists". Lieutenant Governor Election. Retrieved September 2, 2018.
- ^ "Maine became the first state in the country Tuesday to pass ranked choice voting". Boston Globe. November 10, 2016. Retrieved November 17, 2016.
- ^ "Maine Voters Overrule Their Leaders". The Atlantic. June 15, 2018. Retrieved June 24, 2018.
- ^ Emba, Christine. "Maryland election results 2018". The Washington Post. Retrieved November 10, 2018.
- ^ Jump up to: a b c Elections, Maryland State Board of. "2018 Candidate Listing". elections.state.md.us. Retrieved January 16, 2018.
- ^ "Maryland Election Results 2018: Live Midterm Map by County & Analysis". Retrieved December 2, 2018.
- ^ "2018 State Primary - Democratic Candidates for Nomination". Secretary of the Commonwealth of Massachusetts. Retrieved June 6, 2018.
- ^ Jump up to: a b c "2018 State Primary - Republican Candidates for Nomination". Secretary of the Commonwealth of Massachusetts. Retrieved June 6, 2018.
- ^ "Dr. Shiva Ayyadurai on Twitter: "Today Shiva 4 Senate dumped the MA GOP Establishment and Declared Our Independence". Twitter. November 11, 2017. Retrieved November 11, 2017.
- ^ "Massachusetts Election Results 2018: Live Midterm Map by County & Analysis". Retrieved December 2, 2018.
- ^ Jump up to: a b "2018 Michigan Candidate Listing". Michigan Secretary of State. Retrieved April 24, 2018.
- ^ Jump up to: a b "Candidate Filings - 2018 State General Election". Minnesota Secretary of State. Retrieved May 31, 2018.
- ^ "Minnesota Election Results 2018: Live Midterm Map by County & Analysis". Retrieved December 2, 2018.
- ^ "Mississippi Election Results 2018: Live Midterm Map by County & Analysis". Retrieved December 2, 2018.
- ^ Jacobs, Ben (March 5, 2018). "Mississippi Senator Thad Cochran announces he is stepping down". The Guardian. Retrieved March 5, 2018.
- ^ The Washington Post. "Miss. governor names Cindy Hyde-Smith to replace GOP Sen. Thad Cochran. She will be first female U.S. senator from state". Retrieved March 21, 2018.
- ^ Rakich, Nathaniel (March 6, 2018). "How Things Could Go Wrong For Republicans In Mississippi's New Senate Race". FiveThirtyEight. Retrieved April 28, 2018.
- ^ Wagster Pettus, Emily (April 23, 2018). "5 candidates now in special US Senate race in Mississippi". The Seattle Times. Retrieved June 30, 2018.
- ^ Jump up to: a b c "Missouri Candidates Lists". Missouri Secretary of State. Retrieved March 17, 2018.
- ^ "Missouri Election Results 2018: Live Midterm Map by County & Analysis". Retrieved December 2, 2018.
- ^ Jump up to: a b c d e "Montana Primary Candidates Lists". Montana Secretary of state. Archived from the original on March 9, 2018. Retrieved March 12, 2018.
- ^ "Jon Tester reelected to US Senate, holding on to Montana seat for Democrats". Vox. Retrieved December 2, 2018.
- ^ Jump up to: a b c "Statewide Candidate List" (PDF). Nebraska Secretary of State. Retrieved September 2, 2018.
- ^ Jump up to: a b "Official Nebraska Candidate Lists" (PDF). Nebraska Secretary of State. March 1, 2018. Retrieved March 2, 2018.
- ^ "Nebraska Election Results 2018: Live Midterm Map by County & Analysis". Retrieved December 2, 2018.
- ^ Jump up to: a b "2018 United States Senate election in Nevada".
- ^ Jump up to: a b "Nevada Candidates Lists". Nevada Secretary of state.
- ^ "Jacky Rosen unseats Dean Heller in Nevada Senate race". POLITICO. Retrieved December 2, 2018.
- ^ Jump up to: a b "Candidates for US Senate for GENERAL ELECTION" (PDF). New Jersey Election. Retrieved September 2, 2018.
- ^ "New Jersey Election Results 2018: Live Midterm Map by County & Analysis". Retrieved December 2, 2018.
- ^ Jump up to: a b c "New Mexico Major Parties Candidates". KRWG. Retrieved March 26, 2018.
- ^ Jump up to: a b "Who Filed Report". New York State Board of Election. Retrieved April 10, 2018.
- ^ "Certified Results from the November 6, 2018 General Election for U.S. senator" (PDF). Retrieved December 17, 2018.
- ^ Jump up to: a b c "2018 Primary Contest Candidate List". North Dakota Secretary of State. Retrieved April 9, 2018.
- ^ "North Dakota Election Results 2018: Live Midterm Map by County & Analysis". Retrieved December 2, 2018.
- ^ Jump up to: a b c d e f "Secretary of State Jon Husted Receives Statewide Candidate Petitions for May Primary". Ohio Secretary of State. Archived from the original on February 12, 2018. Retrieved March 23, 2018.
- ^ "Can Sherrod Brown win the presidency in 2020? 5 things to know about the Ohio Democrat". Cincinnati.com. Retrieved December 2, 2018.
- ^ Jump up to: a b c "Pennsylvania Candidates Lists". Pennsylvania Secretary of State. Retrieved March 20, 2018.
- ^ "Pennsylvania Election Results 2018: Live Midterm Map by County & Analysis". Retrieved December 2, 2018.
- ^ Jump up to: a b "Candidates in Upcoming Elections". Rhode Island Department of State. Retrieved June 28, 2018.
- ^ "Larry Crim Announces U.S. Senate 2018 Race For Seat Held By Corker". chattanoogan.com. Retrieved February 21, 2017.
- ^ "Corker to end Senate career with this term". Retrieved September 26, 2017.
- ^ Jump up to: a b c "Tennessee candidates Lists" (PDF). Tennessee Secretary of State. Retrieved March 23, 2018.
- ^ "Tennessee Election Results 2018: Live Midterm Map by County & Analysis". Retrieved December 2, 2018.
- ^ Jump up to: a b "November 6, 2018 General Election Ballot". Texas Secretary of State. Retrieved September 2, 2018.
- ^ Wang, Jackie (November 16, 2017). "Christian TV producer challenging Sen. Ted Cruz in GOP primary". Dallas Morning News. Retrieved November 16, 2017.
- ^ "Statement of Organization" (PDF). . June 9, 2017. Retrieved June 14, 2017.
- ^ Tinsley, Anna M. (November 11, 2017). "2018 Election: First day of filing begins with a rush of candidates". Fort Worth Star-Telegram. Retrieved November 16, 2017.
- ^ "MILLER, MARY ANN - Candidate overview". FEC.gov.
- ^ "Former Birdville schools employee joins GOP race to unseat Sen. Ted Cruz". Star-Telegram. Retrieved December 1, 2017.
- ^ "HERNANDEZ, IRASEMA RAMIREZ - Candidate overview". FEC.gov.
- ^ Tinsley, Anna (December 9, 2017). "Deadline for 2018 primary ballot: Monday. Here's who is already in the race". Fort Worth Star-Telegram. Retrieved December 17, 2017.
- ^ "BIBLE, CARL ALEXANDER - Candidate overview". FEC.gov. Retrieved December 21, 2017.
- ^ "AmericanCitizenParty.us". americancitizenparty.us. Archived from the original on July 3, 2019. Retrieved September 9, 2019.
- ^ "Libertarian Candidate Files FEC Complaint Against O'Rourke". The Amarillo Pioneer. Retrieved October 28, 2019.
- ^ Livingston, Patrick Svitek and Abby (November 9, 2018). "How the race between Ted Cruz and Beto O'Rourke became the closest in Texas in 40 years". The Texas Tribune.
- ^ "Texas Election Results 2018: Live Midterm Map by County & Analysis". Retrieved December 2, 2018.
- ^ Lederman, Josh (March 3, 2012). "Hatch will retire in 2018 if he wins reelection". The Hill.
- ^ Raju, Manu (March 9, 2017). "First on CNN: After lobbying from Trump, Orrin Hatch plans to run again". CNN. Retrieved March 11, 2017.
- ^ Dennis Romboy (November 6, 2014). "Sen. Orrin Hatch leaves door ajar for run in 2018". Deseret News. Retrieved December 12, 2014.
- ^ "Utah Candidats Lists". Utah Lieutenant Governor Election. Retrieved March 13, 2018.
- ^ Tanner, Courtney (May 3, 2017). "Navajo candidate announces bid as Democrat for Hatch's seat". The Salt Lake Tribune. Retrieved June 13, 2017.
- ^ Breiner, Andrew (June 21, 2017). "Navajo Candidate Drops Out of Race Against Hatch". Roll Call. Retrieved June 21, 2017.
- ^ Schott, Bryan (April 12, 2017). "Another Democrat looking to knock off Hatch in 2008". Utah Policy. Retrieved April 12, 2017.
- ^ "Thank You". Danny Drew For U.S. Senate. Archived from the original on October 4, 2017. Retrieved October 3, 2017.
- ^ "Mitt Romney Wins Utah Senate Election". Bloomberg.com. November 7, 2018. Retrieved December 2, 2018.
- ^ "2018 General Election Candidates listing". Vermont Secretary of State. Retrieved August 14, 2018.
- ^ "Vermont Election Results 2018: Live Midterm Map by County & Analysis". Retrieved December 2, 2018.
- ^ Jump up to: a b "Certified Candidates and Ballot Order for June 12, 2018 Primary Elections" (PDF). Virginia Department of Elections. Archived from the original (PDF) on June 19, 2018. Retrieved April 5, 2018.
- ^ "Waters for US Senate Turns in Over 14,000 Signatures". Christian Newswire. June 12, 2018. Retrieved November 8, 2018.
- ^ "Kaine tops Stewart to retain Va. seat in US Senate". WTOP. November 6, 2018. Retrieved November 7, 2018.
- ^ "2018 Candidates Who Have Filed". Washington Secretary of State. Retrieved May 18, 2018.
- ^ "Washington Election Results 2018: Live Midterm Map by County & Analysis". Retrieved December 2, 2018.
- ^ Jump up to: a b c d e "West Virginia Candidates Lists" (PDF). West Virginia Secretary of State. Archived from the original (PDF) on March 4, 2018. Retrieved March 4, 2018.
- ^ "West Virginia Election Results 2018: Live Midterm Map by County & Analysis". Retrieved December 2, 2018.
- ^ Jump up to: a b c "Candidate Tracking by Office" (PDF). Wisconsin Election Commission. Retrieved June 11, 2018.[permanent dead link]
- ^ "Wisconsin Election Results 2018: Live Midterm Map by County & Analysis". Retrieved December 2, 2018.
- ^ Jump up to: a b "2018 Primary Election Candidate Roster" (PDF). Wyoming Secretary of State. Retrieved May 23, 2018.
- ^ "Wyoming Election Results 2018: Live Midterm Map by County & Analysis". Retrieved December 2, 2018.
- 2018 United States Senate elections