Houston County, Tennessee
Houston County | |
|---|---|
U.S. county | |
 Houston County Courthouse in April 2014 | |
 Flag Logo | |
 Location within the U.S. state of Tennessee | |
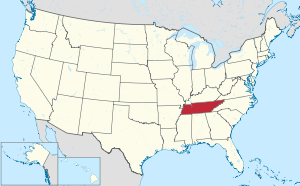 Tennessee's location within the U.S. | |
| Coordinates: 36°17′N 87°43′W / 36.28°N 87.71°W | |
| Country | |
| State | |
| Founded | 1871[1] |
| Named for | Sam Houston[2] |
| Seat | Erin |
| Largest city | Erin |
| Area | |
| • Total | 207 sq mi (540 km2) |
| • Land | 200 sq mi (500 km2) |
| • Water | 6.7 sq mi (17 km2) 3.2%% |
| Population | |
| • Estimate (2018) | 8,263 |
| • Density | 42/sq mi (16/km2) |
| Time zone | UTC−6 (Central) |
| • Summer (DST) | UTC−5 (CDT) |
| Congressional district | 7th |
| Website | www |

Houston County is a county located in the U.S. state of Tennessee. As of the 2010 census, the population was 8,426.[3] Its county seat is Erin.[4] The county was founded in 1871.[1] It was named for Sam Houston.[5]
Geography[]
According to the U.S. Census Bureau, the county has a total area of 207 square miles (540 km2), of which 200 square miles (520 km2) is land and 6.7 square miles (17 km2) (3.2%) is water.[6]
Adjacent counties[]
- Stewart County - north
- Montgomery County - northeast
- Dickson County - east
- Humphreys County - south
- Benton County - west
Major highways[]
- State Route 13
- State Route 46
- State Route 49
- State Route 147
- State Route 149
- State Route 231
- State Route 232
Demographics[]
| Historical population | |||
|---|---|---|---|
| Census | Pop. | %± | |
| 1880 | 4,295 | — | |
| 1890 | 5,390 | 25.5% | |
| 1900 | 6,476 | 20.1% | |
| 1910 | 6,224 | −3.9% | |
| 1920 | 6,212 | −0.2% | |
| 1930 | 5,555 | −10.6% | |
| 1940 | 6,432 | 15.8% | |
| 1950 | 5,318 | −17.3% | |
| 1960 | 4,794 | ��9.9% | |
| 1970 | 5,845 | 21.9% | |
| 1980 | 6,871 | 17.6% | |
| 1990 | 7,018 | 2.1% | |
| 2000 | 8,088 | 15.2% | |
| 2010 | 8,426 | 4.2% | |
| 2018 (est.) | 8,263 | [7] | −1.9% |
| U.S. Decennial Census[8] 1790-1960[9] 1900-1990[10] 1990-2000[11] 2010-2014[3] | |||

As of the census[13] of 2000, there were 8,088 people, 3,216 households, and 2,299 families residing in the county. The population density was 40.4 people per square mile (15.6/km2). There were 3,901 housing units at an average density of 19.5 per square mile (7.5/km2). The racial makeup of the county was 94.58% White, 3.31% Black or African American, 0.19% Native American, 0.12% Asian, 0.06% Pacific Islander, 0.78% from other races, and 0.95% from two or more races. 1.25% of the population were Hispanic or Latino of any race.
There were 3,216 households, out of which 31.10% had children under the age of 18 living with them, 57.00% were married couples living together, 10.40% had a female householder with no husband present, and 28.50% were non-families. 25.30% of all households were made up of individuals, and 12.10% had someone living alone who was 65 years of age or older. The average household size was 2.46 and the average family size was 2.92.
In the county, the population was spread out, with 24.40% under the age of 18, 7.30% from 18 to 24, 26.10% from 25 to 44, 25.60% from 45 to 64, and 16.70% who were 65 years of age or older. The median age was 40 years. For every 100 females there were 97.80 males. For every 100 females age 18 and over, there were 95.00 males.
The median income for a household in the county was $29,968, and the median income for a family was $35,395. Males had a median income of $29,528 versus $19,983 for females. The per capita income for the county was $15,614. About 14.30% of families and 18.10% of the population were below the poverty line, including 23.20% of those under age 18 and 20.80% of those age 65 or over.
Government[]
Like many other rural southern and/or Appalachian counties, Houston County was a Democratic stronghold at the presidential level, but due to a combination of factors (such as the party's national shift on social liberalism, a direct contrast to the social conservatism of the region; lack of support for workers in these counties; and, arguably, racial/cultural animus to Barack Obama's campaign in 2008), the county (and state as a whole) has sped rapidly toward the Republican Party. The county's last Democratic presidential preference, Obama, won here in 2008, but by a deeply closer margin than any winning Democrat in recent memory.
Today's Houston County is as solidly Republican as historically GOP-friendly East Tennessee.
The Board of Commissioners meets at the Houston County Courthouse the third Monday of odd months (January, March, May, July, September, November).
Elected officials[]
- County Mayor: James Bridges[15]
- County Clerk: Robert Brown[16]
- Administrator of Elections: Annette Pulley
- Property Assessor: Joy Hooper
- Register of Deeds: Sherrill Potts Moore
- County Trustee: Jimmy Lowery
- County Highway Department Superintendent: George Dew
- County Circuit Court Clerk: Donna Potts Vincent
- General Sessions & Juvenile Judge: W. Sidney Vinson
- Sheriff: Kevin L. Sugg
Commissioners[]
- District 1: William C. Agy and Ann Fielder[15]
- District 2: Randall French and J. Steve Hall
- District 3: Glenn Baggett and Danny Warren
- District 4: Charles Darrell Kingsmill and Howard Spurgeon
- District 5: Lance Uffelman and Vickie Reedy
- District 6: Joey Brake and Chris Pitts
- District 7: Brant Lamastus and Tony Hayes
Politics[]
Houston County has traditionally been one of the state's most Democratic counties. However, the county is somewhat conservative on social issues and has been trending Republican. It was part of Tennessee's 8th congressional district, which was represented by Blue Dog Democrat John S. Tanner. It is now part of Tennessee's 7th congressional district and is represented by Republican Mark E. Green.
The county has been among the most consistently Democratic in the state on presidential elections. Democratic candidates failed to carry Houston County at the presidential level only twice prior to 2012. In 1928, Herbert Hoover became the first Republican presidential candidate to ever carry Houston County, due to anti-Catholic voting against Al Smith in this "Bible Belt" region.[17] The second non-Democrat to carry Houston County was George Wallace of the American Independent Party during the 1968 presidential election, following which Houston County became one of only six Wallace counties to vote for George McGovern against Richard Nixon's 3,000-plus-county landslide of 1972.[a]
In the 2008 presidential election, when most other traditionally Democratic counties in the state voted for John McCain, Houston County supported Barack Obama. However, the county's vote has been shifting Republican as reflected by Barack Obama's winning margin of barely more than 2%, the lowest margin among all Democratic presidential candidates who have carried Houston County since its creation.[18] In the 2012 presidential election, Mitt Romney became the first Republican in 80 years to win the county.[19] Republican Senator Bob Corker[20] and Republican Representative Marsha Blackburn also won the county.[21] However, in all cases it was by a narrower margin than statewide or district wide.
Education[]
Public high schools[]
- Houston County High School - (Students: 465; Location: 2500 State Route 149; Grades: 09 - 12)
- Houston County Adult High School - (Students: 2; Location: 3573 West Main Street; Grades: 11 - 12)
Public primary/middle schools[]
- Erin Elementary School - (Students: 456; Location: 6500 State Route 13; Grades: KG - 05)
- Tennessee Ridge Elementary School - (Students: 280; Location: 135 School Street; Grades: KG - 05)
- Houston County Middle School - (Students: 338; Location: 1241 West Main Street; Grades: 06 - 08)
Media[]
- FM radio: WTPR-FM 101.7 (website) "The Greatest Hits of All Time"
- Weekly newspaper: (website)
- ""Tv Station""
Communities[]
City[]
- Erin (county seat)
Town[]
- Tennessee Ridge (small part in Stewart County)
Unincorporated communities[]
See also[]
- National Register of Historic Places listings in Houston County, Tennessee
Further reading[]
- History of Houston County, Tennessee 1871 - 1996 - History and Families. Nashville: Turner Publishing Company (1995). ISBN 1-56311-194-2
Notes[]
References[]
- ^ Jump up to: a b Tennessee State Library and Archives, Genealogical "Fact sheets" about counties. "Houston County: Houston County was formed in 1871 from Dickson, Humphreys and Montgomery Counties. Acts of Tennessee 1870-71, Chapter 46." Retrieved December 7, 2010
- ^ Charles Lovelady and Nina Finley, "Houston County," Tennessee Encyclopedia of History and Culture. Retrieved: 17 October 2013.
- ^ Jump up to: a b "State & County QuickFacts". United States Census Bureau. Archived from the original on June 7, 2011. Retrieved December 2, 2013.
- ^ "Find a County". National Association of Counties. Archived from the original on 2011-05-31. Retrieved 2011-06-07.
- ^ Gannett, Henry (1905). The Origin of Certain Place Names in the United States. Govt. Print. Off. pp. 161.
- ^ "2010 Census Gazetteer Files". United States Census Bureau. August 22, 2012. Retrieved April 5, 2015.
- ^ "Population and Housing Unit Estimates". Retrieved July 20, 2019.
- ^ "U.S. Decennial Census". United States Census Bureau. Retrieved April 5, 2015.
- ^ "Historical Census Browser". University of Virginia Library. Retrieved April 5, 2015.
- ^ Forstall, Richard L., ed. (March 27, 1995). "Population of Counties by Decennial Census: 1900 to 1990". United States Census Bureau. Retrieved April 5, 2015.
- ^ "Census 2000 PHC-T-4. Ranking Tables for Counties: 1990 and 2000" (PDF). United States Census Bureau. April 2, 2001. Retrieved April 5, 2015.
- ^ Based on 2000 census data
- ^ "U.S. Census website". United States Census Bureau. Retrieved 2011-05-14.
- ^ Leip, David. "Dave Leip's Atlas of U.S. Presidential Elections". uselectionatlas.org. Retrieved 2018-03-10.
- ^ Jump up to: a b "Archived copy". Archived from the original on 2015-04-02. Retrieved 2015-03-30.CS1 maint: archived copy as title (link)
- ^ "Archived copy". Archived from the original on 2015-04-02. Retrieved 2015-03-30.CS1 maint: archived copy as title (link)
- ^ Phillips, Kevin P.; The Emerging Republican Majority, p. 212 ISBN 1400852293
- ^ David Leip’s Presidential Election Atlas (Election maps for Tennessee)
- ^ CNN results for Tennessee
- ^ CNN Results for Senate
- ^ CNN results for Tennessee's 7th district
External links[]
| Wikimedia Commons has media related to Houston County, Tennessee. |
- Houston County Chamber of Commerce
- Houston County, TNGenWeb - free genealogy resources for the county
- . The American Cyclopædia. 1879.
- Houston County at Curlie
| show Places adjacent to Houston County, Tennessee |
|---|
| show Municipalities and communities of Houston County, Tennessee, United States |
|---|

Coordinates: 36°17′N 87°43′W / 36.28°N 87.71°W
| show Authority control |
|---|
- Tennessee counties
- Houston County, Tennessee
- 1871 establishments in Tennessee
- Populated places established in 1871
- Sam Houston