Naujan-et-Postiac
Naujan-et-Postiac | |
|---|---|
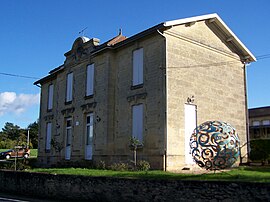 Town hall | |
 Coat of arms | |
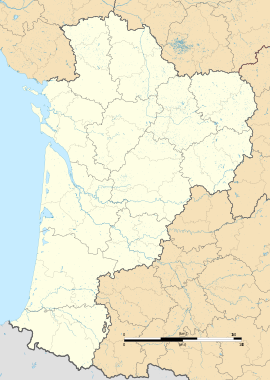
show Location of Naujan-et-Postiac | |
 Naujan-et-Postiac | |
| Coordinates: 44°47′22″N 0°10′49″W / 44.7894°N 0.1803°WCoordinates: 44°47′22″N 0°10′49″W / 44.7894°N 0.1803°W | |
| Country | France |
| Region | Nouvelle-Aquitaine |
| Department | Gironde |
| Arrondissement | Libourne |
| Canton | Les Coteaux de Dordogne |
| Government | |
| • Mayor (2008–2014) | Michel Clabé |
| Area 1 | 11.1 km2 (4.3 sq mi) |
| Population (Jan. 2018)[1] | 595 |
| • Density | 54/km2 (140/sq mi) |
| Time zone | UTC+01:00 (CET) |
| • Summer (DST) | UTC+02:00 (CEST) |
| INSEE/Postal code | 33301 /33420 |
| Elevation | 6–91 m (20–299 ft) (avg. 40 m or 130 ft) |
| 1 French Land Register data, which excludes lakes, ponds, glaciers > 1 km2 (0.386 sq mi or 247 acres) and river estuaries. | |


Naujan-et-Postiac is a commune in the Gironde department in Nouvelle-Aquitaine in southwestern France.
At 35 km from Bordeaux, 6 km south of the river Dordogne.
A nice area of the Entre-Deux-Mers region (between the two rivers of Dordogne and Garonne), where the vineyard is still very important, as it is less and less in the southern direction.
It has nice rural architecture, well kept in the traditional style make the most part of religious and housing buildings, as of the several châteaux in the wine business. The woods and small valleys are still enough in the countryside view to allow a charm near exception if it were not also a quality of so many other villages of the area.
The present administrative and geographical situation of the commune comes from the association of two villages and their dependencies before the French Revolution, and the confirmation in the new national organization created in 1802. The church of the village of Postiac, which became then private property is slowly disappearing under growing trees.
Population[]
| Year | Pop. | ±% |
|---|---|---|
| 1962 | 553 | — |
| 1968 | 500 | −9.6% |
| 1975 | 435 | −13.0% |
| 1982 | 423 | −2.8% |
| 1990 | 520 | +22.9% |
| 1999 | 500 | −3.8% |
| 2008 | 498 | −0.4% |
See also[]
References[]
- ^ "Populations légales 2018". INSEE. 28 December 2020.
| Wikimedia Commons has media related to Naujan-et-Postiac. |
This Gironde geographical article is a stub. You can help Wikipedia by . |
- Communes of Gironde
- Gironde geography stubs