Villars-les-Dombes
show This article may be expanded with text translated from the corresponding article in French. (December 2008) Click [show] for important translation instructions. |
Villars-les-Dombes | |
|---|---|
Commune | |
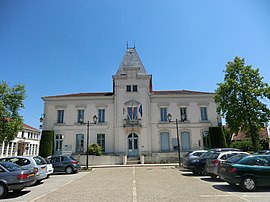 The town hall in Villars-les-Dombes | |
 Coat of arms | |
show Location of Villars-les-Dombes | |
 Villars-les-Dombes | |
| Coordinates: 45°59′56″N 5°01′48″E / 45.9989°N 5.0299°ECoordinates: 45°59′56″N 5°01′48″E / 45.9989°N 5.0299°E | |
| Country | France |
| Region | Auvergne-Rhône-Alpes |
| Department | Ain |
| Arrondissement | Bourg-en-Bresse |
| Canton | Villars-les-Dombes |
| Intercommunality | Dombes |
| Government | |
| • Mayor (2020–2026) | Pierre Larrieu |
| Area 1 | 24.63 km2 (9.51 sq mi) |
| Population (Jan. 2018)[1] | 4,962 |
| • Density | 200/km2 (520/sq mi) |
| Time zone | UTC+01:00 (CET) |
| • Summer (DST) | UTC+02:00 (CEST) |
| INSEE/Postal code | 01443 /01330 |
| Elevation | 263–295 m (863–968 ft) (avg. 279 m or 915 ft) |
| 1 French Land Register data, which excludes lakes, ponds, glaciers > 1 km2 (0.386 sq mi or 247 acres) and river estuaries. | |


Villars-les-Dombes (French pronunciation: [vilaʁ le dɔ̃b] (![]() listen), literally Villars near Dombes) is a commune in the Ain department in eastern France.
Its people are known as Villardois.
listen), literally Villars near Dombes) is a commune in the Ain department in eastern France.
Its people are known as Villardois.
Geography[]
The town is located within Ain, half-way between Lyon (33 km) and Bourg-en-Bresse (29 km), in the heart of the area known as the Dombes, notable for its hundreds of lakes which are waterfowl habitats and are suitable for breeding fish. Its ornithological park, Parc des Oiseaux, is the largest in France.
The Chalaronne river forms part of the commune's south-western border, flows northward through the western part of the commune, crosses the town, then forms part of its northern border.
History[]
The lordship of Villars (of which archival evidence dates from 940) became, by marriage, the lordship of Thoire-et-Vilars in 1188, and in about 1400 its caput was Trévoux (the estate was managed from there). In 1565, Villars was promoted to a marquisate dependent on the house of Savoie (Savoy), a benefice of the Honour of Savoy.
Population[]
|
|
See also[]
References[]
- ^ "Populations légales 2018". INSEE. 28 December 2020.
External links[]
| Wikimedia Commons has media related to Villars-les-Dombes. |
- (in French) Official website
- (in French) Dombes and Villars-les-Dombes
- (in French) Photos of Villars-les-Dombes
| show Authority control |
|---|
This Ain geographical article is a stub. You can help Wikipedia by . |
- Communes of Ain
- Dombes
- Ain geography stubs