Acigné
Acigné | |
|---|---|
 The church of Acigné | |
 Coat of arms | |
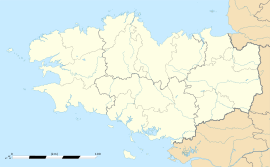
show Location of Acigné | |
 Acigné | |
| Coordinates: 48°08′05″N 1°32′07″W / 48.1347°N 1.5353°WCoordinates: 48°08′05″N 1°32′07″W / 48.1347°N 1.5353°W | |
| Country | France |
| Region | Brittany |
| Department | Ille-et-Vilaine |
| Arrondissement | Rennes |
| Canton | Liffré |
| Intercommunality | Rennes Métropole |
| Government | |
| • Mayor (2020–2026) | Olivier Dehaese[1] |
| Area 1 | 29.55 km2 (11.41 sq mi) |
| Population (Jan. 2018)[2] | 6,814 |
| • Density | 230/km2 (600/sq mi) |
| Time zone | UTC+01:00 (CET) |
| • Summer (DST) | UTC+02:00 (CEST) |
| INSEE/Postal code | 35001 /35690 |
| Elevation | 29–90 m (95–295 ft) |
| 1 French Land Register data, which excludes lakes, ponds, glaciers > 1 km2 (0.386 sq mi or 247 acres) and river estuaries. | |


Acigné (Gallo: Aczeinyae) is a commune in the Ille-et-Vilaine department in Brittany in northwestern France.
History[]
Evidences of ancient occupation of the site go back to 3500 BCE.
The areas was evangelized by Martin of Tours or his disciples in the 4th century.
In 1010, Rivallon, Baron of Vitré ceded the territory of Acigné to his son Renaud. This dynasty lasted until the 16th century, when the line ended with the marriage of Judith d'Acigné to the marshall of Cossé-Brissac.
From the 11th to the 18th centuries, part of the territory of the commune belonged to the Abbeys of Saint Melaine and Saint Georges in Rennes.
In 1234, the castle was destroyed by the Duke of Brittany, Pierre Mauclerc to punish Alain d'Acigné for having sided with the king of France (Louis IX) against him.
During the French Revolution, the village sided with its clergy and was punished by being sacked by a troupe of national guard in 1792.[3]
Population[]
Industrialization brought a marked exodus during the 19th and 20th centuries. However, in the 1970s, this trend was reversed, and the population again increased.[4]
Inhabitants of Acigné are called Acignolais in French.
| Year | Pop. | ±% |
|---|---|---|
| 2006 | 5,785 | — |
| 2007 | 5,931 | +2.5% |
| 2008 | 6,143 | +3.6% |
| 2009 | 6,167 | +0.4% |
| 2010 | 6,166 | −0.0% |
| 2011 | 6,166 | +0.0% |
| 2012 | 6,275 | +1.8% |
| 2013 | 6,282 | +0.1% |
| 2014 | 6,398 | +1.8% |
| 2015 | 6,521 | +1.9% |
| 2016 | 6,645 | +1.9% |
See also[]
- Communes of the Ille-et-Vilaine department
References[]
- ^ "Répertoire national des élus: les maires". data.gouv.fr, Plateforme ouverte des données publiques françaises (in French). 2 December 2020.
- ^ "Populations légales 2018". INSEE. 28 December 2020.
- ^ Le patrimoine des communes d'Ille et Vilaine cited on the official website.
- ^ Ibid.
External links[]
| Wikimedia Commons has media related to Acigné. |
- Official website
- Cultural Heritage (in French)
| show Communes of the Ille-et-Vilaine department |
|---|
| show Authority control |
|---|
This Ille-et-Vilaine geographical article is a stub. You can help Wikipedia by . |
- Communes of Ille-et-Vilaine
- Ille-et-Vilaine geography stubs