Mézières-en-Brenne
Mézières-en-Brenne | |
|---|---|
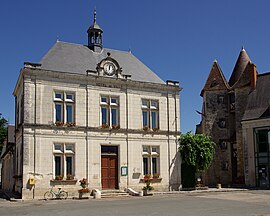 The town hall in Mézières-en-Brenne | |
 Coat of arms | |
show Location of Mézières-en-Brenne | |
 Mézières-en-Brenne | |
| Coordinates: 46°49′18″N 1°12′41″E / 46.8217°N 1.2114°ECoordinates: 46°49′18″N 1°12′41″E / 46.8217°N 1.2114°E | |
| Country | France |
| Region | Centre-Val de Loire |
| Department | Indre |
| Arrondissement | Le Blanc |
| Canton | Le Blanc |
| Government | |
| • Mayor (2020–2026) | Jean-Louis Camus |
| Area 1 | 57.57 km2 (22.23 sq mi) |
| Population (Jan. 2018)[1] | 996 |
| • Density | 17/km2 (45/sq mi) |
| Time zone | UTC+01:00 (CET) |
| • Summer (DST) | UTC+02:00 (CEST) |
| INSEE/Postal code | 36123 /36290 |
| Elevation | 84–138 m (276–453 ft) (avg. 90 m or 300 ft) |
| 1 French Land Register data, which excludes lakes, ponds, glaciers > 1 km2 (0.386 sq mi or 247 acres) and river estuaries. | |


Mézières-en-Brenne (French pronunciation: [mezjɛːʁ ɑ̃ bʁɛn] (![]() listen)) is a commune in the Indre department in central France.
listen)) is a commune in the Indre department in central France.
Natural park[]
It is located is at the heart of the Brenne regional natural park. The Brenne is one of France's most important wetlands. A large diversity of natural habitats is responsible for an abundance of wildlife of which the best known are the birds: purple heron, black-necked grebe, bittern, marsh harrier, whiskered tern, short-toed eagle. The Brenne is also Europe's most important site for the European .[citation needed]
Population[]
|
|
See also[]
- Communes of the Indre department
References[]
- ^ "Populations légales 2018". INSEE. 28 December 2020.
External links[]
| Wikimedia Commons has media related to Mézières-en-Brenne. |
| show Communes of the Indre department |
|---|
| show Authority control |
|---|
This Indre geographical article is a stub. You can help Wikipedia by . |
Categories:
- Communes of Indre
- Touraine
- Indre geography stubs